

2026-01-28
Nural Choudhury
AI generates components faster than review can catch them. Design governance, not tooling, is the control that stops generated work fragmenting your system.
A product manager describes a table in plain English and gets working code back before the design system team has heard about it. The component references a spacing token that does not exist. It sits there for a fortnight before anyone notices.
That is the new failure mode, and it lands on organisations that never fixed the old one. Design ops has always failed from misdiagnosis rather than underinvestment: the symptom presents as inefficiency, the request goes in for tooling, and tooling was never the constraint. Generative tooling just removed the delay that used to hide it.
Because a model will generate a production-ready component in seconds from an incomplete specification, and it will not flag that the token it referenced is imaginary. Governance used to be the thing that made design scale. It is now the thing that stops generated work fragmenting the system faster than anyone can review it.
The tool has no judgement and works from the context it is given. A system that has already drifted will have its drift reproduced at speed and at volume, which turns a slow-burning consistency problem into a compounding one.
Design governance has also stopped being purely internal. The EU AI Act’s transparency obligations came into force on 2 August 2026, while its high-risk obligations were deferred to December 2027 and August 2028 [1]. ISO/IEC 42001, the management-system standard for AI, is increasingly asked for in procurement [2]. Where AI touches your product surface, the question of who approved this now has an audience outside the building.

Because the blocker is decision rights, and no tool assigns them. When I ran discovery across the Insight and Design division of a UK retail bank, mid-restructure and split across ten PODs and fifty-two sub-PODs, eighteen stakeholder interviews produced a consistent stated need: better tools. The rework rate at the time was climbing past 40 per cent.
What I said when the research came back, roughly: “Everyone asked for better tools. Nobody is blocked on tools. They’re blocked on not knowing who decides, and no quantity of Figma licences fixes that.”
The teams already had Figma. They had the hardware. What they lacked was any shared answer to who decides what, when a decision gets made, and how work passes between teams.
Fifty-two sub-teams, each with its own invented way of working. No shared language, no quality gates, no consistent process. The fragmentation was structural, and buying software for a structural problem is buying a faster car when the problem is that there are no roads.
The published data now says the same thing. Zeroheight’s 2026 report, from 147 design system practitioners, found that only 38 per cent of systems are widely or fully adopted, while 38 per cent sit at moderate adoption and 23 per cent are barely used at all [3]. The components exist. Getting people to use them is a different problem, and it has stayed the top challenge five years running.

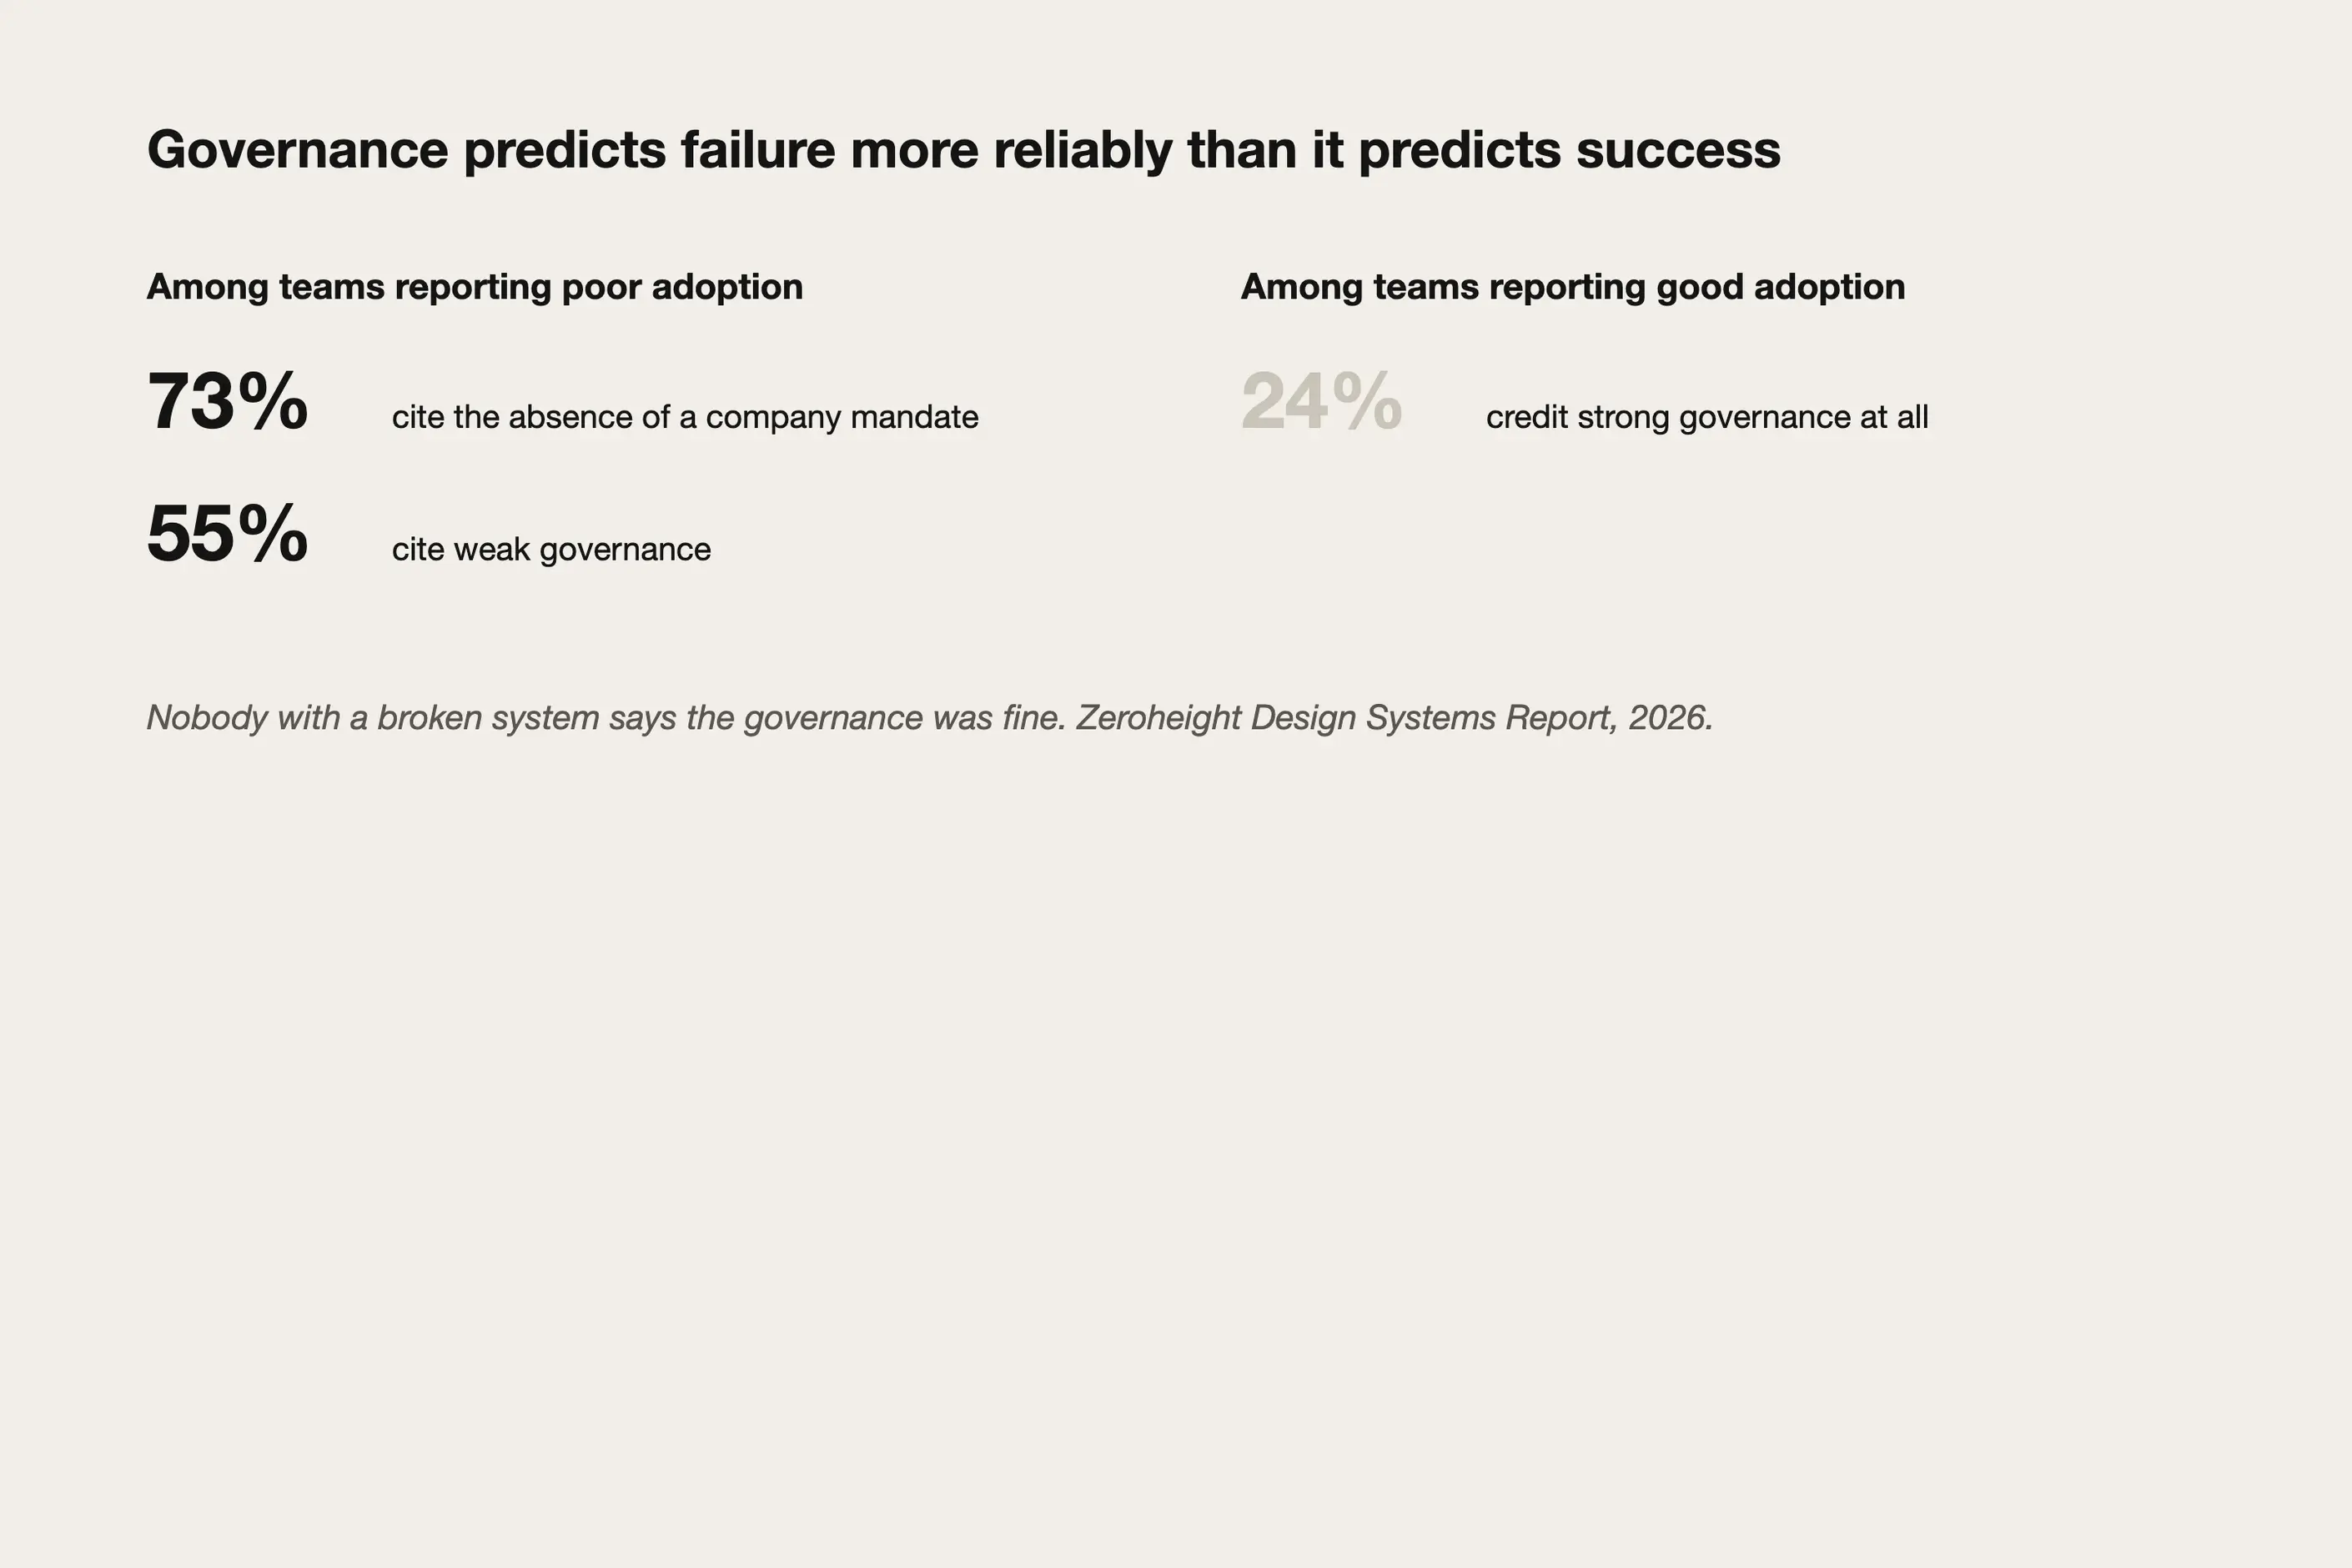
It shows governance predicts failure more reliably than it predicts success, which is a more useful finding than the one people usually quote. Among teams reporting poor adoption, 73 per cent cite the absence of a company mandate and 55 per cent cite weak governance. Among teams reporting good adoption, only 24 per cent credit strong governance at all.
Read those two lists together and the asymmetry is the insight. Governance is not what makes a design system succeed. Its absence is what makes one fail. That distinction matters when you are asking for funding, because it changes the claim from a promise of improvement into a description of exposure.
These are self-reported figures, and self-reporting is weak at attributing your own success. But the shape survives that weakness. Nobody with a broken system says the governance was fine.
It means three questions answered in writing, and nothing more mystical than that.
Who decides. When a new component is needed, who approves it. When quality drifts, who has authority to intervene. When resources are short, who prioritises.
How do we know. The trigger for a decision, the information required to make it, and where the single source of truth sits.
Then propagation. How a decision travels, who needs telling, and how implementation gets verified.
At a global specialty chemicals company we found designers making ad-hoc calls with no review process, not because anyone was rogue but because no process existed. When every decision is made individually you do not get freedom. You get fifty-two interpretations of on-brand, and no way to tell which one is right.
Frame it as exposure rather than efficiency, because efficiency invites a comparison and exposure invites a control. This is the reframe that unlocked the bank.
The efficiency pitch was already on the table and going nowhere. “Design ops will make our teams more efficient” earns the reply “efficiency is nice, what is the ROI?” The risk pitch names seven categories of uncontrolled exposure instead, and earns the reply “show me the controls.”
| Risk | What happens without governance |
|---|---|
| Experience quality | Inconsistent journeys ship to customers. Brand erodes. |
| Delivery | Unclear handoffs. Rework. Missed dates. |
| Compliance | No accessibility checkpoint. Regulatory exposure. |
| Knowledge | Tribal knowledge. Single points of failure. |
| Talent | No career pathway. Designers leave. |
Every mechanism we built was a control against a named risk: quality gates at each stage, a RACI for decision rights, operating rhythms that guaranteed leadership touchpoints.
We measured a 35 per cent improvement in developer efficiency and a 40 per cent reduction in deployment time. For comparison, the cleanest controlled study I know of is Sparkbox timing eight developers on the same form with and without IBM’s Carbon system: a 47 per cent reduction, familiarisation included [4]. My figures sit below that, which is where a first-party number should sit.
The timing matters more than it did. Satisfaction with organisational buy-in fell from 42 per cent to 32 per cent year on year, and most design ops leaders reading this are defending a function rather than building one. Exposure language is what survives a budget round. Efficiency language is what gets cut in it.
The funding mechanics of that argument, and the risk taxonomy it should be recorded against, are set out in why the design business case keeps losing.
Rhythm is the other half, and documentation is the half that fails on its own. At the bank we ran five interlocking ceremonies, each carrying a specific governance job rather than existing as a meeting.
Practice partner connect, fortnightly. Leadership alignment on direction.
Practice monthly, whole team. Knowledge sharing, and the culture that makes contribution feel safe.
Office hours, weekly. Direct leadership access for any practitioner.
Resource meeting, weekly. Capacity planning and allocation.
Cross-functional retrospective, fortnightly. Improvement with product and engineering in the room.
Information flows up, decisions flow down, knowledge flows across. Without the rhythms you have governance as theory, which is a fifty-six page document nobody opens.
Start with the smallest rhythm you can hold weekly, because a playbook cannot be rolled out overnight and office hours can begin on Thursday.
Audit the real problem. Interview people and watch how work flows in practice. The stated problem is better tools. The real problem is usually unclear decision rights.
Write down who decides. A RACI and a visual process map. Making the implicit explicit is most of the work.
Measure delivery risk rather than designer happiness. Time to decision, quality consistency, rework rate. These are the numbers that survive contact with a finance review.
Every design organisation already has governance. Most have never decided what theirs is, so it accumulated by default: invisible, inconsistent, and owned by nobody.
So the question is not whether to govern. If a model generated a non-compliant component into your product tomorrow, who would notice, how long would it take, and whose name is against the decision to ship it?
Grades: primary means the issuing body’s own publication; first-party means my own measurement.
First-party figures, measured on engagements I led and without a control group: ten PODs and fifty-two sub-PODs, eighteen stakeholder interviews and a rework rate past 40 per cent at a UK retail bank, with the five operating rhythms and the 56-page playbook built there; 35 per cent developer efficiency and 40 per cent faster deployment at a global specialty chemicals company.
The opening scenario, a generated component referencing a token that does not exist, is a composite of the failure mode described in 2026 design-systems practice rather than a single logged incident.