

2026-09-15
Nural Choudhury
A service blueprint is a diagram that maps what a customer experiences against the staff actions and systems that produce it, on one shared timeline.
The service failure everyone blames on a different department, because nobody can see the backstage systems and handoffs behind what the customer experiences. Without a shared diagram, the argument about whose fault it is never resolves.
Take that cross-team argument and point at the exact layer and boundary line where the failure happens, instead of everyone defending their own department. The prioritised findings feed the MoSCoW method to turn them into a backlog, and guide where technology and operations investment goes.
A five-layer blueprint with the three boundary lines marked, pain points traced back to the layer that causes them, and a prioritised list of fixes with a named owner and a review date against each.
G. Lynn Shostack published “Designing Services That Deliver” in the January 1984 issue of Harvard Business Review. She argued that services fail not because of staff incompetence but because of the absence of a systematic method for designing and controlling them, and that a diagram of the whole service process lets a team find failure points before customers do. The method’s roots sit in services marketing and operations, decades before it became a fixture of design practice.
Shostack’s original blueprint used a single line separating what a customer sees from what happens behind it. The three-line structure now taught as standard, the line of interaction, the line of visibility and the line of internal interaction, was added afterwards by Jane Kingman-Brundage. The five-layer model most practitioners draw today, with physical evidence as its own row, was formalised by Mary Jo Bitner, Amy L. Ostrom and Felicia N. Morgan in their 2008 California Management Review paper. What gets taught as “the” service blueprint is Shostack’s diagnosis plus more than two decades of refinement by other researchers.

Building a blueprint runs through four stages: research, layer-mapping, workshop synthesis and prioritisation. Each stage produces what the next one needs.
Observe and interview customers to learn what they do and feel at each step, rather than relying on internal assumptions about their experience. Interview frontline and backstage staff separately, since documented processes often differ from daily practice. Sit with system owners to map what the technology and data flows genuinely support. This stage takes the longest, because the three sets of information live in different parts of the organisation and nobody has reconciled them before.
A blueprint stacks five horizontal layers, read top to bottom as the service moves from the customer’s hands into the organisation’s.
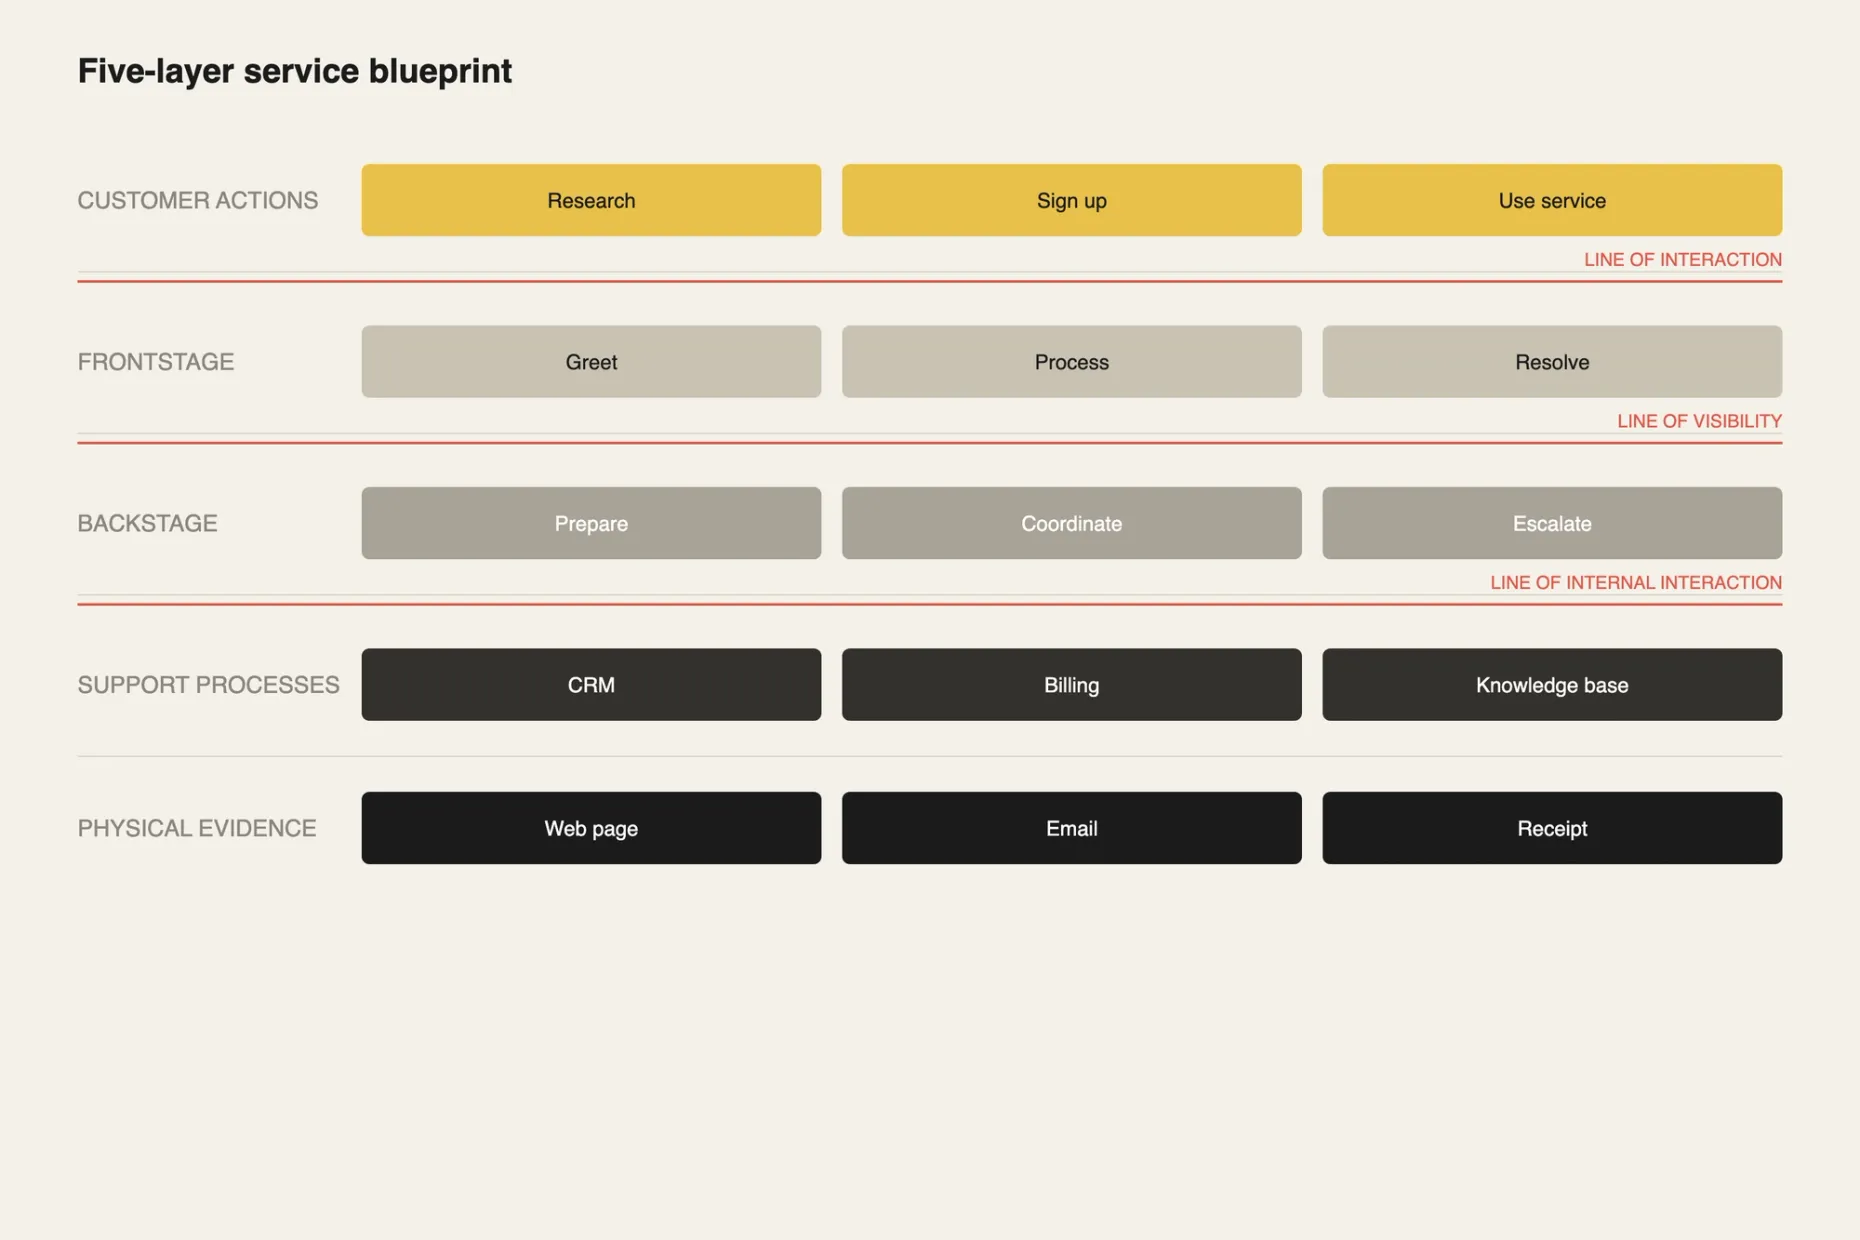
Three horizontal lines separate the layers, and each one marks a different kind of gap.
Bring together customer-facing functions such as sales, support, and success; backstage functions such as operations and fulfilment; and enabling functions such as IT, compliance, and HR. Share your research before the workshop, so participants arrive with the same evidence instead of restating assumptions. Work through the journey phases in order, one layer at a time, on a wall or a digital whiteboard the group can edit as it goes. Splitting the work across three sessions, one for the customer journey, one for frontstage and backstage, one for support processes and prioritisation, keeps each session focused on a single layer rather than holding all five at once.
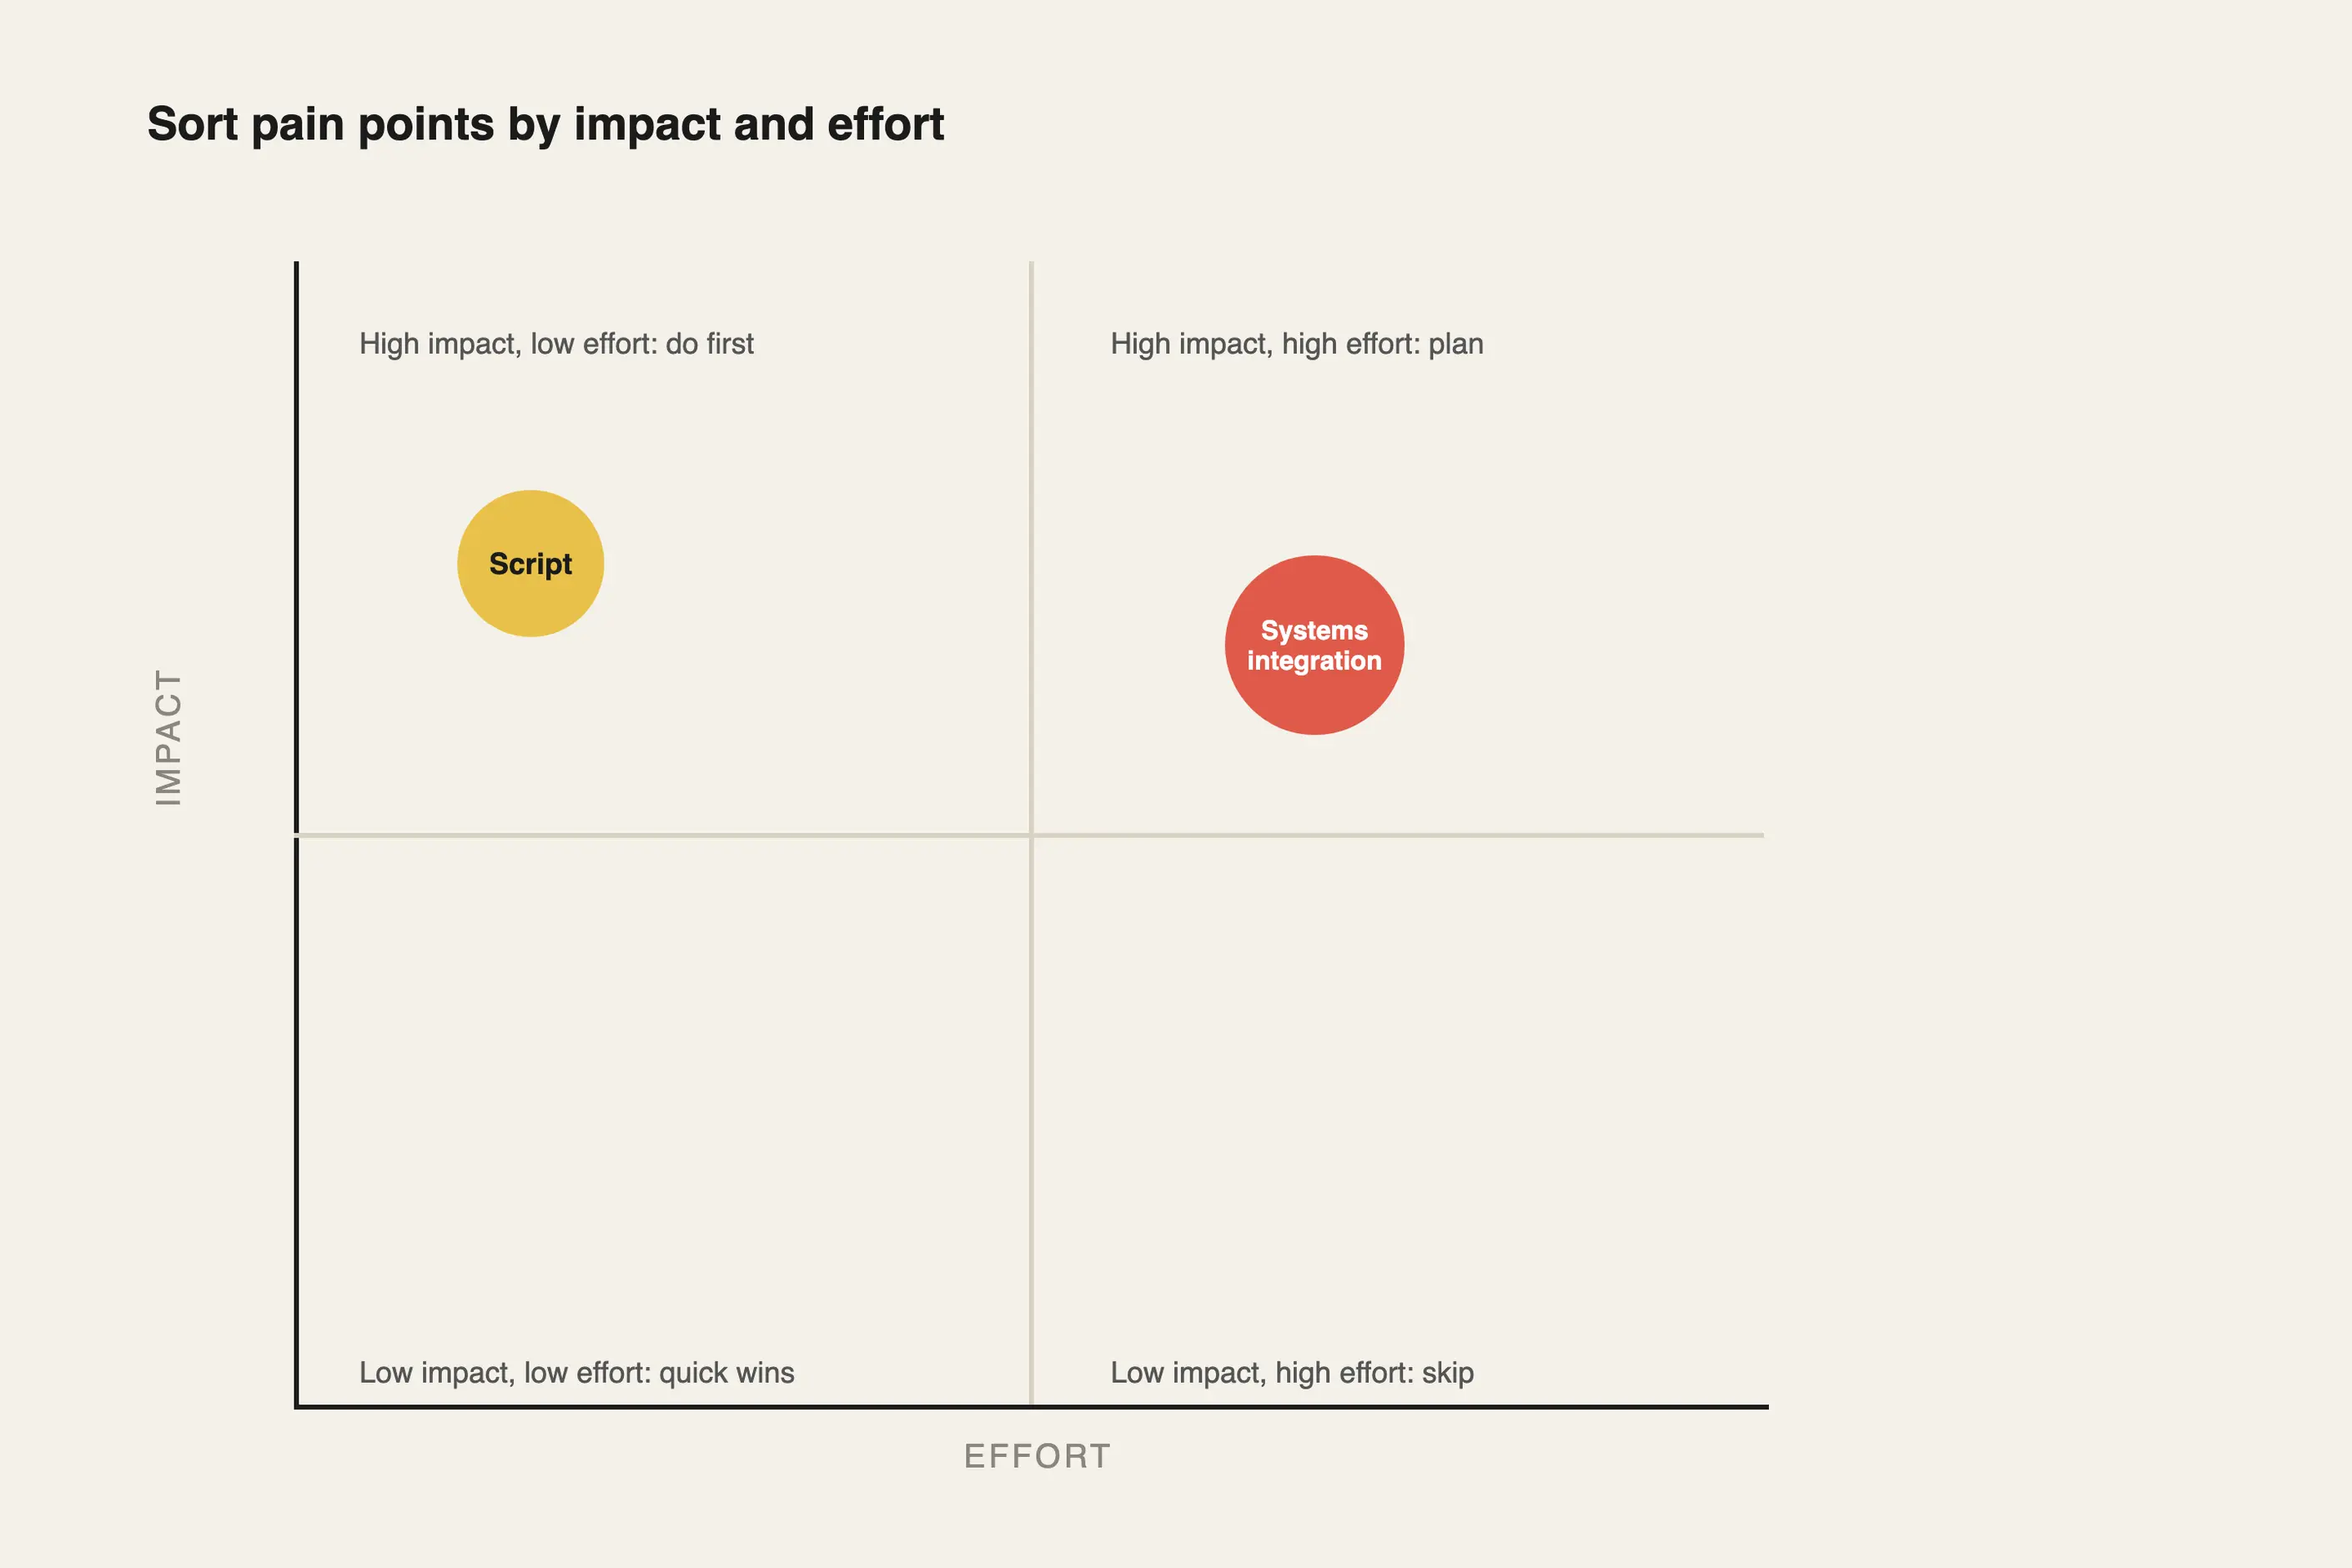
Trace each pain point, a wait, a failure, a difficult handoff, back to the layer that causes it rather than stopping at the symptom a customer reports. Decide what new capabilities the fix needs and what integrations it depends on before you commit. Sort what you find by impact and effort, and use a method built for that trade-off, such as the MoSCoW method, to turn the list into a backlog someone will build.
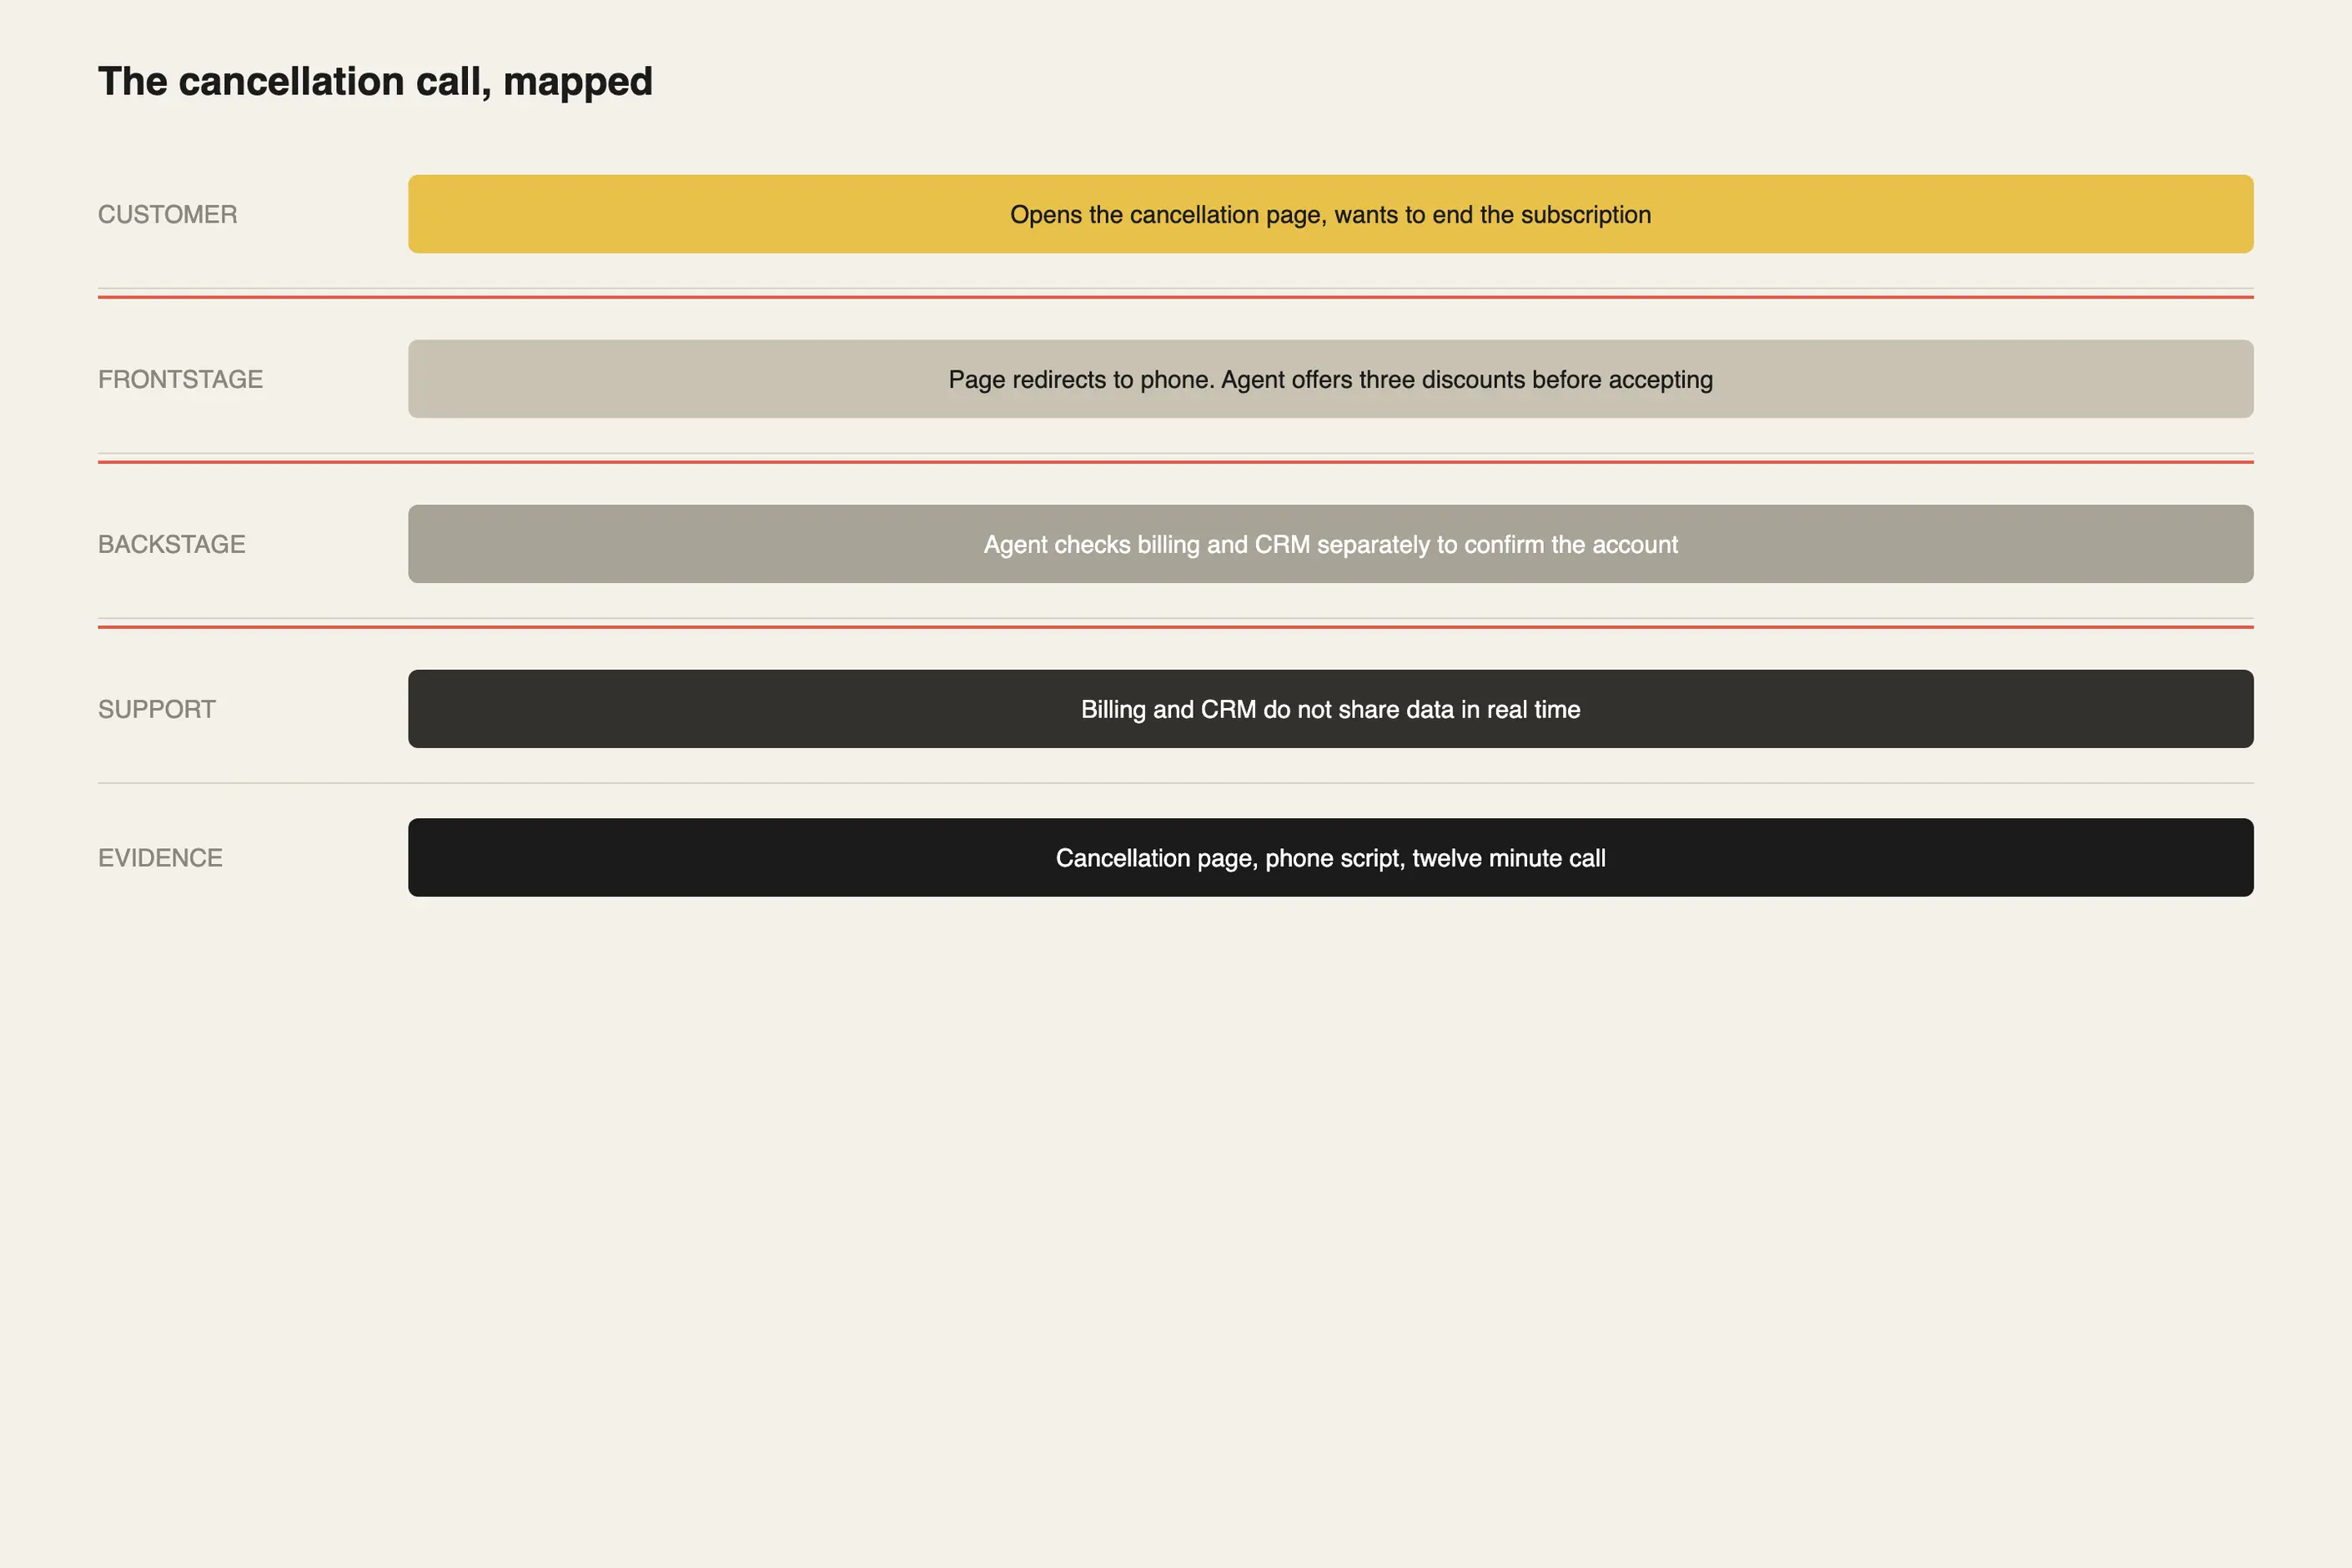
Take a subscription service where a customer can cancel online or by phone. The customer opens the cancellation page, wanting to end the subscription, and the page redirects to a phone number instead of processing the request. A retention agent answers, following a script that requires three discount offers before accepting the cancellation, and checks two separate systems, billing and the CRM, to confirm the account, because the two do not share data in real time. The call runs to twelve minutes; a self-service flow, if the organisation allowed one, would take under two.
| Layer | What happens in this example |
|---|---|
| Customer action | Wants to cancel a subscription |
| Frontstage action | Cancellation page redirects to a phone line; an agent offers three discounts before accepting the cancellation |
| Backstage action | Agent checks two unsynced systems, billing and the CRM, to confirm the account |
| Support process | Billing platform and CRM do not share data in real time |
| Physical and digital evidence | The cancellation page itself, styled as self-service but functioning as a phone gate |
Mapped this way, the blueprint locates the twelve-minute call precisely: a support-process gap and a scripted phone flow, three layers below the customer’s simple decision to leave. Fixing the script without fixing the systems gap moves the twelve minutes somewhere else in the process. Fixing both removes it.
When I build a blueprint from management’s account of how the service works, without direct customer and frontline research, I get a polished diagram of an imagined service. What managers believe happens and what genuinely happens diverge more often than most workshops assume. I do not trust a blueprint built on that kind of data, because it structures the wrong problem with total confidence.
A live service keeps changing after the workshop ends: staff turns over, systems get replaced, processes drift. A blueprint drawn once and pinned to a wall documents a single moment, and I have watched its authority outlive its accuracy once nobody owns keeping it current. That is the usual outcome, so I insist on a named owner and a review date, the same way any other piece of operational documentation gets one.
I do not map straight from internal documentation or assumption, without observing frontstage interactions directly, because it produces a diagram that is internally consistent and wrong. The frontstage is where the organisation’s service model meets what customers do, and a blueprint built from second-hand accounts inherits every gap between the two. Blueprinting before that research exists is backwards.
When I map every touchpoint, system and handoff at uniform depth, I produce an artefact too dense to act on. The map is not the improvement plan, and mapping everything while prioritising nothing is the failure I see most often. Without a deliberate pass that ranks pain points by impact and cost, a comprehensive blueprint sits as a reference document rather than driving the changes it surfaced.
G. Lynn Shostack, in “Designing Services That Deliver”, Harvard Business Review, January 1984. She was working in services marketing, not design.
No. Shostack’s original blueprint used a single boundary line. The three-line structure and the five-layer model, including physical evidence as its own row, were added later, principally by Jane Kingman-Brundage and by Bitner, Ostrom and Morgan’s 2008 paper.
It depends on how much frontstage research already exists before I start. I expect the research phase to take longer than the workshop itself because it draws on customers, frontline staff, and system owners, each of whom holds only part of the picture.
What is the difference between a service blueprint and a customer journey map? A journey map documents the customer’s experience alone. A blueprint adds the frontstage, backstage and support layers underneath it, so a diagnosis of why a moment in the journey is broken has somewhere to point.
When you have not done direct frontstage research yet, when the service is too small or too stable to need cross-functional coordination, or when nobody in the organisation is positioned to keep the resulting artefact current.
| Fact | Detail |
|---|---|
| Proper name | Service blueprint (the diagram), service blueprinting (the practice) |
| Created by | G. Lynn Shostack, then senior vice president at Bankers Trust Company |
| First published | “Designing Services That Deliver”, Harvard Business Review, January 1984, Vol. 62, No. 1, pp. 133 to 139 |
| Field of origin | Services marketing and operations, not design practice |
| Later refinement | The three boundary lines were added afterwards by Jane Kingman-Brundage; the five-layer model with physical evidence as its own row was formalised by Mary Jo Bitner, Amy L. Ostrom and Felicia N. Morgan in “Service Blueprinting: A Practical Technique for Service Innovation”, California Management Review, 2008 |

User research is the systematic study of what users do, need and struggle with, combining qualitative depth with quantitative scale to ground design in evidence.
Read it
Task analysis is the systematic study of how people currently perform a task, breaking it down into the steps, decisions and knowledge each one requires.
Read it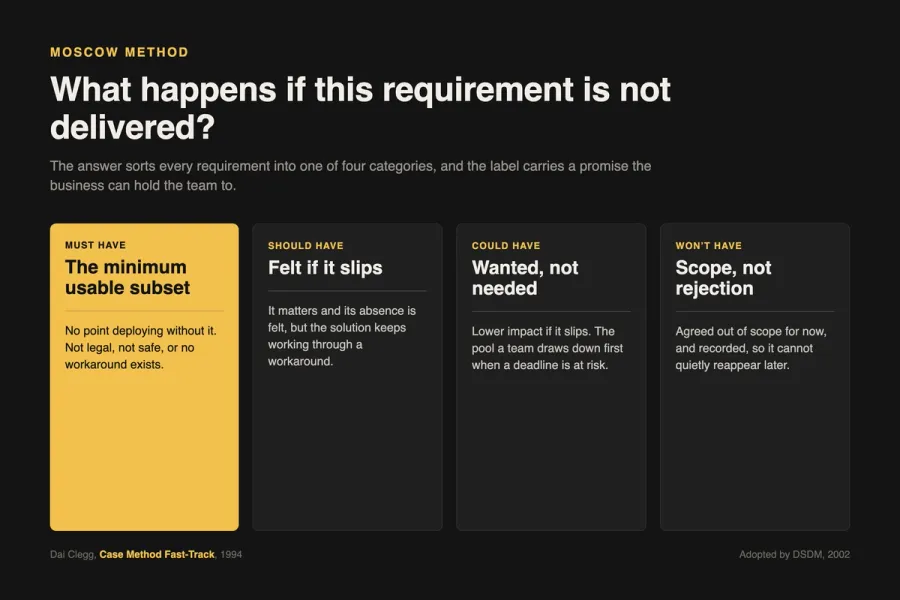
The MoSCoW method is a requirements-prioritisation technique that sorts features into Must Have, Should Have, Could Have, and Won’t Have, protecting a fixed delivery date without cutting corners nobody chose to cut.
Read it
A design sprint is a five-day process that takes a team from a business problem to a tested prototype, revealing whether an idea works before it is built.
Read it
A design system is a governed set of reusable components, patterns and rules that a team uses to build consistent digital products at scale, and it is neither a static style guide nor a component library on its own.
Read it