

2026-09-15
Nural Choudhury
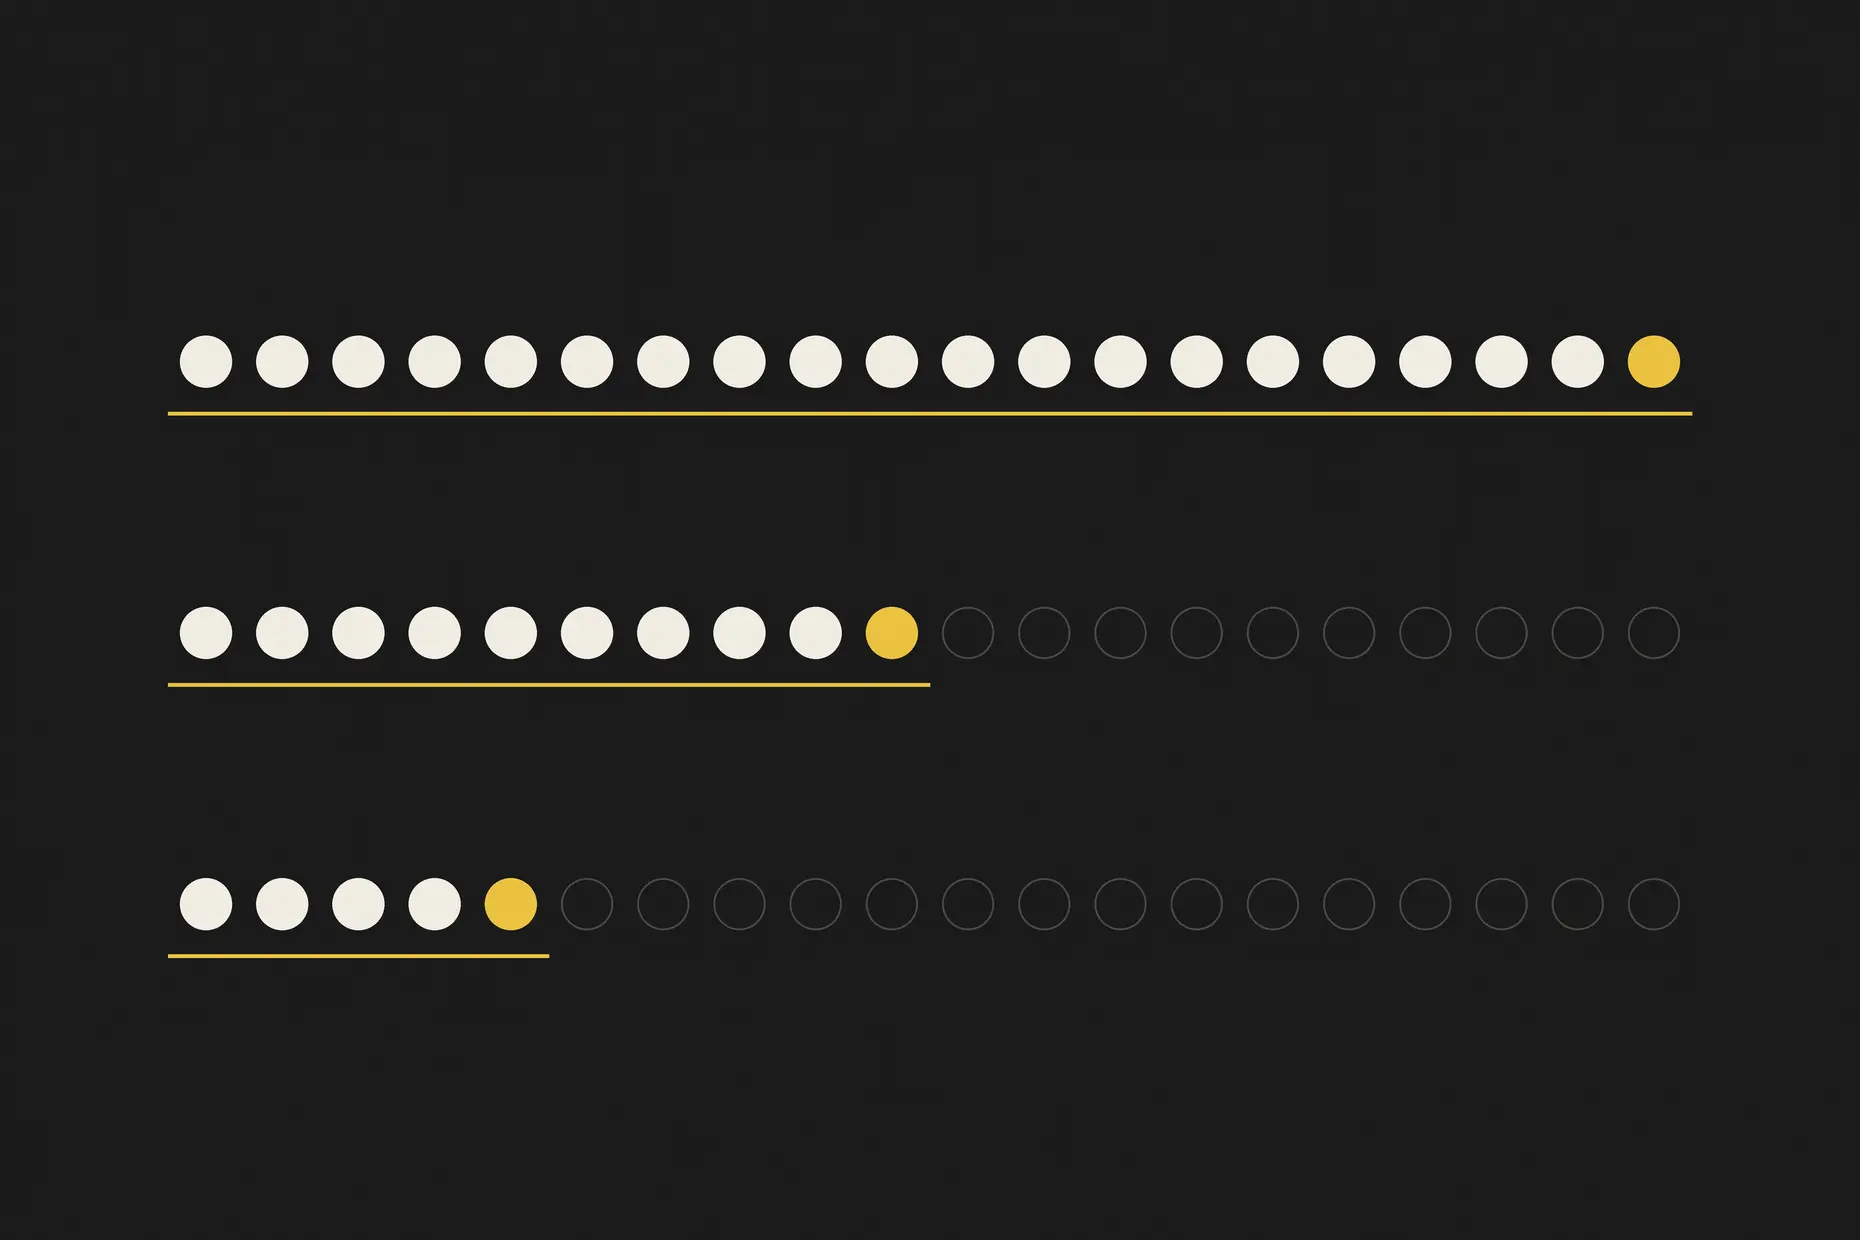
The 20-10-5 attention model sets a working time budget for holding attention: 20 seconds on digital, 10 on video, 5 on social.
I built this to end the review argument over whether a piece of content is good when there is no shared standard, and the answer depends on who is rostered that day.
With thresholds in hand, you can hold a review to a checkable standard instead of individual taste, and put the guidance into onboarding and templates rather than relying on whoever is in the room.
platform-specific attention thresholds, design guidance for what has to be visible, audible, or legible inside each window, and review questions built from those thresholds. The numbers come from one newsroom’s audience at one point in time, never published or peer-reviewed, and they measure attention, not comprehension.
I built the 20-10-5 model as Senior Creative Director at CNN International between 2013 and 2016, leading the design team as content moved across digital, broadcast, and social platforms.
To find a shared standard, I ran an internal observation study with 45 users, timing how long each group engaged before they left, stayed, or moved on. Digital readers held on for about 20 seconds, video viewers for about 10, and social viewers for about 5. I never published those figures or put them through peer review; they describe one newsroom’s audience, at one point in time.
Once the team designed against those thresholds, overall user engagement rose by 35 per cent and onboarding time for a new designer fell by 30 per cent. Those are my own figures from that period, measured internally and never published, so treat them as what the model did for one newsroom rather than as a result you should expect.
Current research places the scroll-or-stay decision at roughly one to three seconds, tighter than any of my three windows: they measure how long attention holds once granted, not whether it is granted at all. That entry decision is faster now than when I built the model. However, Nielsen Norman Group still finds users abandoning a page within ten to twenty seconds without an early value proposition, close to my digital threshold. I keep the thresholds and treat the faster entry decision as the piece the original study missed.
I treat 20-10-5 as a working rule of thumb, not a law of attention. It travels because most content teams work across a similar spread of platforms, not because the numbers themselves are universal.
1. Research your audience. Watch how long your readers, viewers, and followers engage before they leave, stay, or click on each platform you use. Pull the broad pattern from analytics, then run a short observation session to catch what the numbers miss. I run this step because it gives me real thresholds instead of borrowed ones, and it costs me a day or two per platform.
2. Set platform-specific thresholds. Fix a time window for each platform, using 20-10-5 as your opening guess if you have nothing better yet. Longer content and B2B audiences often tolerate more; fast entertainment feeds often demand less. I use this step to turn observation into a number I can design against, and it takes about an hour once I have the data.
3. Translate thresholds into design guidance. Decide what has to be visible, audible or legible inside your window on each platform: a headline and subhead for a twenty-second digital page, a hook and title card for a ten-second video open, a single image or line for a five-second social post. I use this step to give designers a checklist instead of a feeling, and it costs one workshop to write down.
4. Build review questions from the thresholds. Turn each threshold into a question you ask at every review: does this land inside twenty seconds, does the hook work in the first ten, does the post read in five? I ask these because they make the standard enforceable rather than aspirational, and they add only a few minutes to each review.
5. Iterate against real outcomes. Track engagement against your thresholds, and adjust the number where the data disagrees with where you started. I now pair each threshold with completion rate rather than dwell time alone, since distribution algorithms reward finishing a piece over merely lingering on it. This keeps the model honed as my audience, platforms and how they measure attention all change.

Say you are publishing one story as a web page, a two-minute video and a social clip.
For the web page, you have about twenty seconds. The headline states the outcome, not a clever line: “Prices fall for the first time in three years,” not “A turning point.” The subhead and opening paragraph carry the rest of the value, and everything else sits below the fold.
For the video, you have about ten seconds. Open on the strongest image or line, not on context: show the result before you explain how you got there. A bold, plain title card confirms what the viewer is watching before they decide whether to keep watching.
For the social clip, you have about five seconds. One image and one line carry the whole message; anything that needs a caption to make sense has already lost. Crop for a vertical phone screen, since that is where most of the audience will see it.
None of these numbers is fixed. Time each format against your own audience once you have run step one, and adjust the windows before you lock them into review questions.
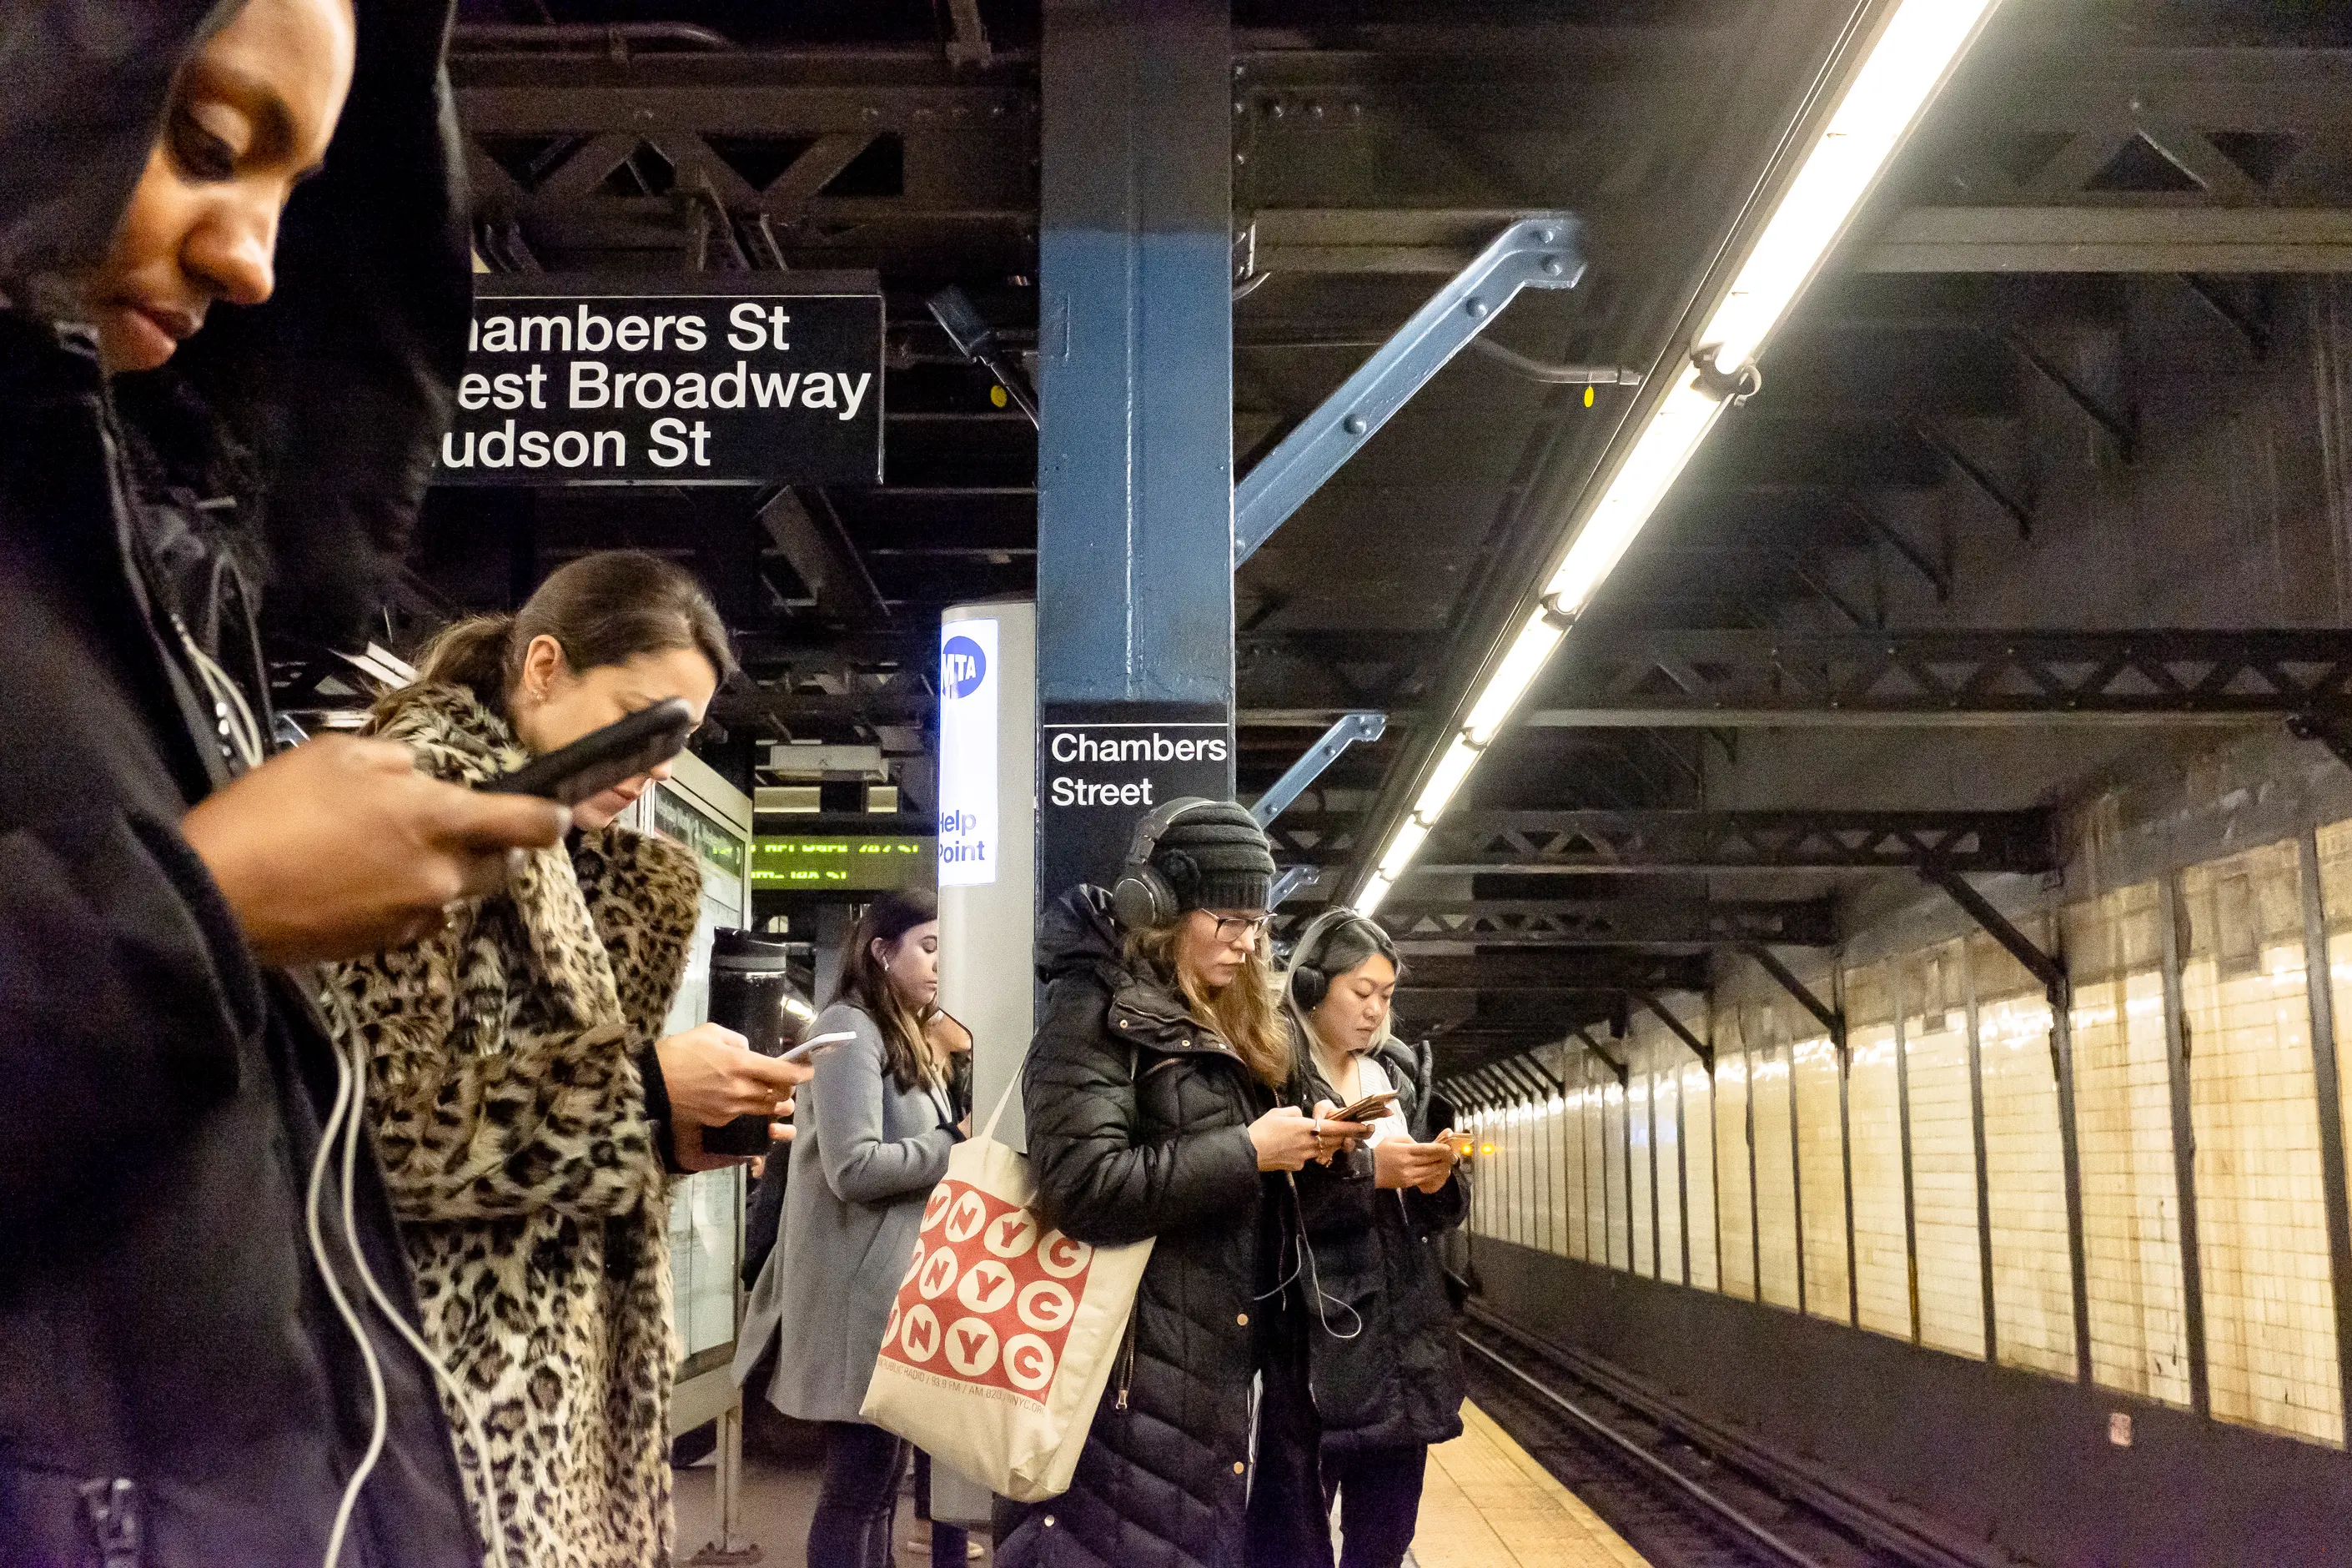
A single threshold cannot hold across every audience and content type. I have seen a technical B2B audience already committed to reading a document behave nothing like a phone user scrolling a feed. Using one number for both starves the first group of detail, or bores the second before they reach the point.
Attention time is not comprehension. I have watched a reader stay on a page for twenty seconds and remember nothing, and another leave after five seconds having acted on exactly what they saw. The model measures whether I kept someone’s eyes, not whether I changed their mind, and treating the two as the same thing optimises the content for the wrong outcome.
Optimising for the first few seconds trades away depth. I have seen a team that scores every review against 20-10-5 gradually lose the ability to write anything that needs more than twenty seconds to land, because a model built around hooks rewards headlines and openings, not arguments. I use the model for time-pressured formats, and set it aside for long-form reporting or technical documentation, where the reader’s commitment is already made before they start reading.
Measuring by dwell time alone is also out of step with how the industry judges content now. Distribution algorithms, TikTok among them, favour completion rate and engagement depth over passive dwell time, and frameworks from DoubleVerify and the IAB and MRC now combine exposure, engagement, and interaction rather than one signal. Time still matters: a Lumen and Ebiquity study found a strong correlation between attentive minutes per thousand impressions and incremental profit, so I add completion rate rather than replace dwell time with it.
I got them from an internal observation study I ran at CNN International between 2013 and 2016, not from a published or peer-reviewed source. Treat them as a starting rule of thumb, not a fixed law.
No. They fit the news audience I built them for, one switching quickly between platforms. A B2B audience already reading a report, or an entertainment audience already following a series, can behave differently, so test the thresholds against your own data before you rely on them.
Is a longer attention window always better? Not necessarily. The window tells you how long someone stayed, not whether they understood or acted on what they saw. A short, clear post can outperform a long one that holds attention but doesn’t land its point.
Apply the threshold for whichever platform the reader meets first, then design the rest of the piece to reward attention already earned.
Revisit them whenever your audience, platform mix or content format changes, and check at least once a year even if nothing has shifted.
| Field | Detail |
|---|---|
| Created by | I built it, as Senior Creative Director at CNN International, running the design team |
| Created | 2013 to 2016 |
| Also called | The 20-10-5 model |
| Origin evidence | An internal observation study I ran with 45 users at CNN International, unpublished and not peer reviewed |
| Typical setup time | A day or two of research per platform, plus one workshop to translate it into design guidance |
| Team size it suits | Any, from a solo content creator to a multi-platform newsroom team |

User research is the systematic study of what users do, need and struggle with, combining qualitative depth with quantitative scale to ground design in evidence.
Read it
Data analysis for design is the practice of testing decisions against measured evidence, usage data, and controlled experiments, rather than defending them by opinion alone.
Read it
A content audit is a catalogue of every piece of content you own, scored against what it is supposed to do, so you can decide what to keep, fix, merge or kill.
Read it