

2026-01-28
Nural Choudhury
Quality arguments lose because quality reads as discretionary. Map design exposure onto the Basel operational-risk taxonomy and it becomes a funded control.
You made the case. Better experience, higher conversion, improved satisfaction. The executive nodded, thanked you, and funded the platform migration instead.
Design quality is hard to sell because quality is an argument about taste, and taste has no losing side. Exposure is different. It has a register, an owner, and a line in the operating plan, and organisations are built to fund controls against it.
Use the one your organisation already recognises, which in most regulated firms is the Basel operational-risk event taxonomy maintained by ORX and used by more than a hundred financial institutions [6]. Inventing a private set of design risks is the most common way this approach fails, because a category the risk function does not recognise cannot be entered into the register.
Design work maps mostly onto one Level 1 category and touches two others.
| Basel Level 1 event type | How design exposure presents | Control |
|---|---|---|
| Execution, delivery and process management | Rework, unclear handoffs, inconsistent interpretation between design and build | Governed design system, quality gates, decision rights |
| Clients, products and business practices | Inaccessible journeys, unclear disclosure, mis-selling through interface design | Accessibility conformance, disclosure patterns, evidenced user testing |
| Employment practices and workplace safety | Key-person dependency, no career pathway, attrition of scarce capability | Documented standards, contribution model, progression framework |
That mapping does more than tidy the language. It puts design exposure into a taxonomy the second line already reports on, which means somebody other than you is now carrying the number.
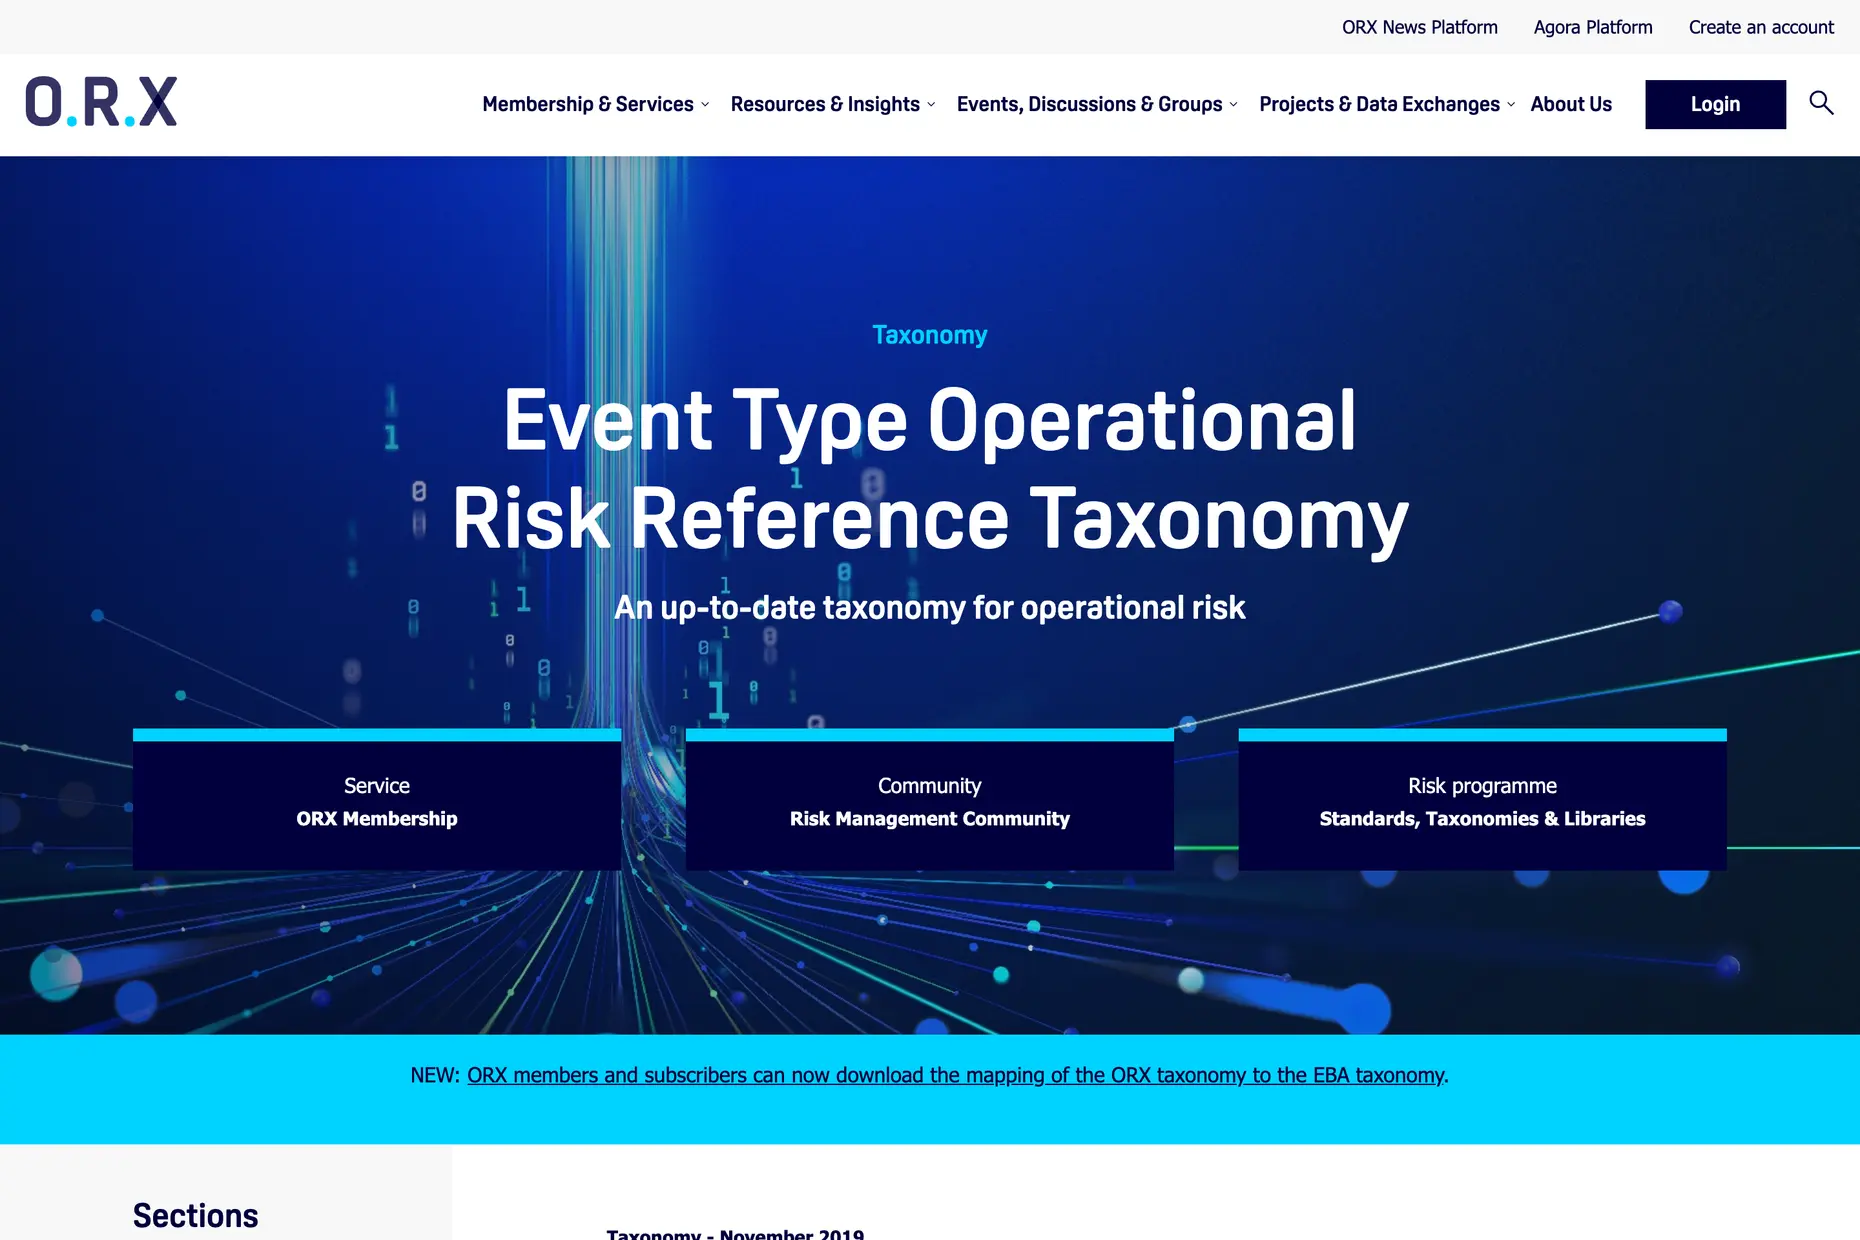
Because quality reads as discretionary and risk reads as mandatory. Nobody decides to ship bad design. They decline to fund the thing that would have prevented it, which produces the same outcome through a defensible-looking decision.
Quality also carries no agreed unit. When you say the experience improved, the finance director hears a claim they cannot audit, cannot compare against the other four proposals in front of them, and cannot defend if it turns out wrong. A risk claim survives all three tests, because the organisation already has machinery for recording exposure and evidencing controls.
The shift is not a rebrand. It is choosing the frame in which your evidence is admissible.

At a UK retail bank I was brought in to transform design operations across 52 sub-teams. The pitch already on the table was efficiency, and it had stalled: “design ops will make our teams more efficient” had earned “efficiency is nice, what is the ROI?”
I put the same programme forward as uncontrolled exposure across seven categories, with a proposed control against each. The reply changed to “show me the controls.” The investment was approved, and every deliverable we built mapped to a named risk rather than to a capability.
Nothing about the work changed. The register it was recorded in did.
The sharpest version of this I have used was at a wealth platform sitting at 40 per cent accessibility coverage, in a market with two regulators watching. What I said to the executive committee, roughly: “I can show you that as a design problem or as an audit finding. It’s the same number either way, and only one of those versions has a budget line.”
Accessibility, because it is the one design exposure that is already law and already being enforced. The European Accessibility Act has applied since 28 June 2025, its harmonised standard EN 301 549 carries WCAG conformance into that obligation [3], and UK public sector bodies are monitored against WCAG 2.2 Level AA [4].
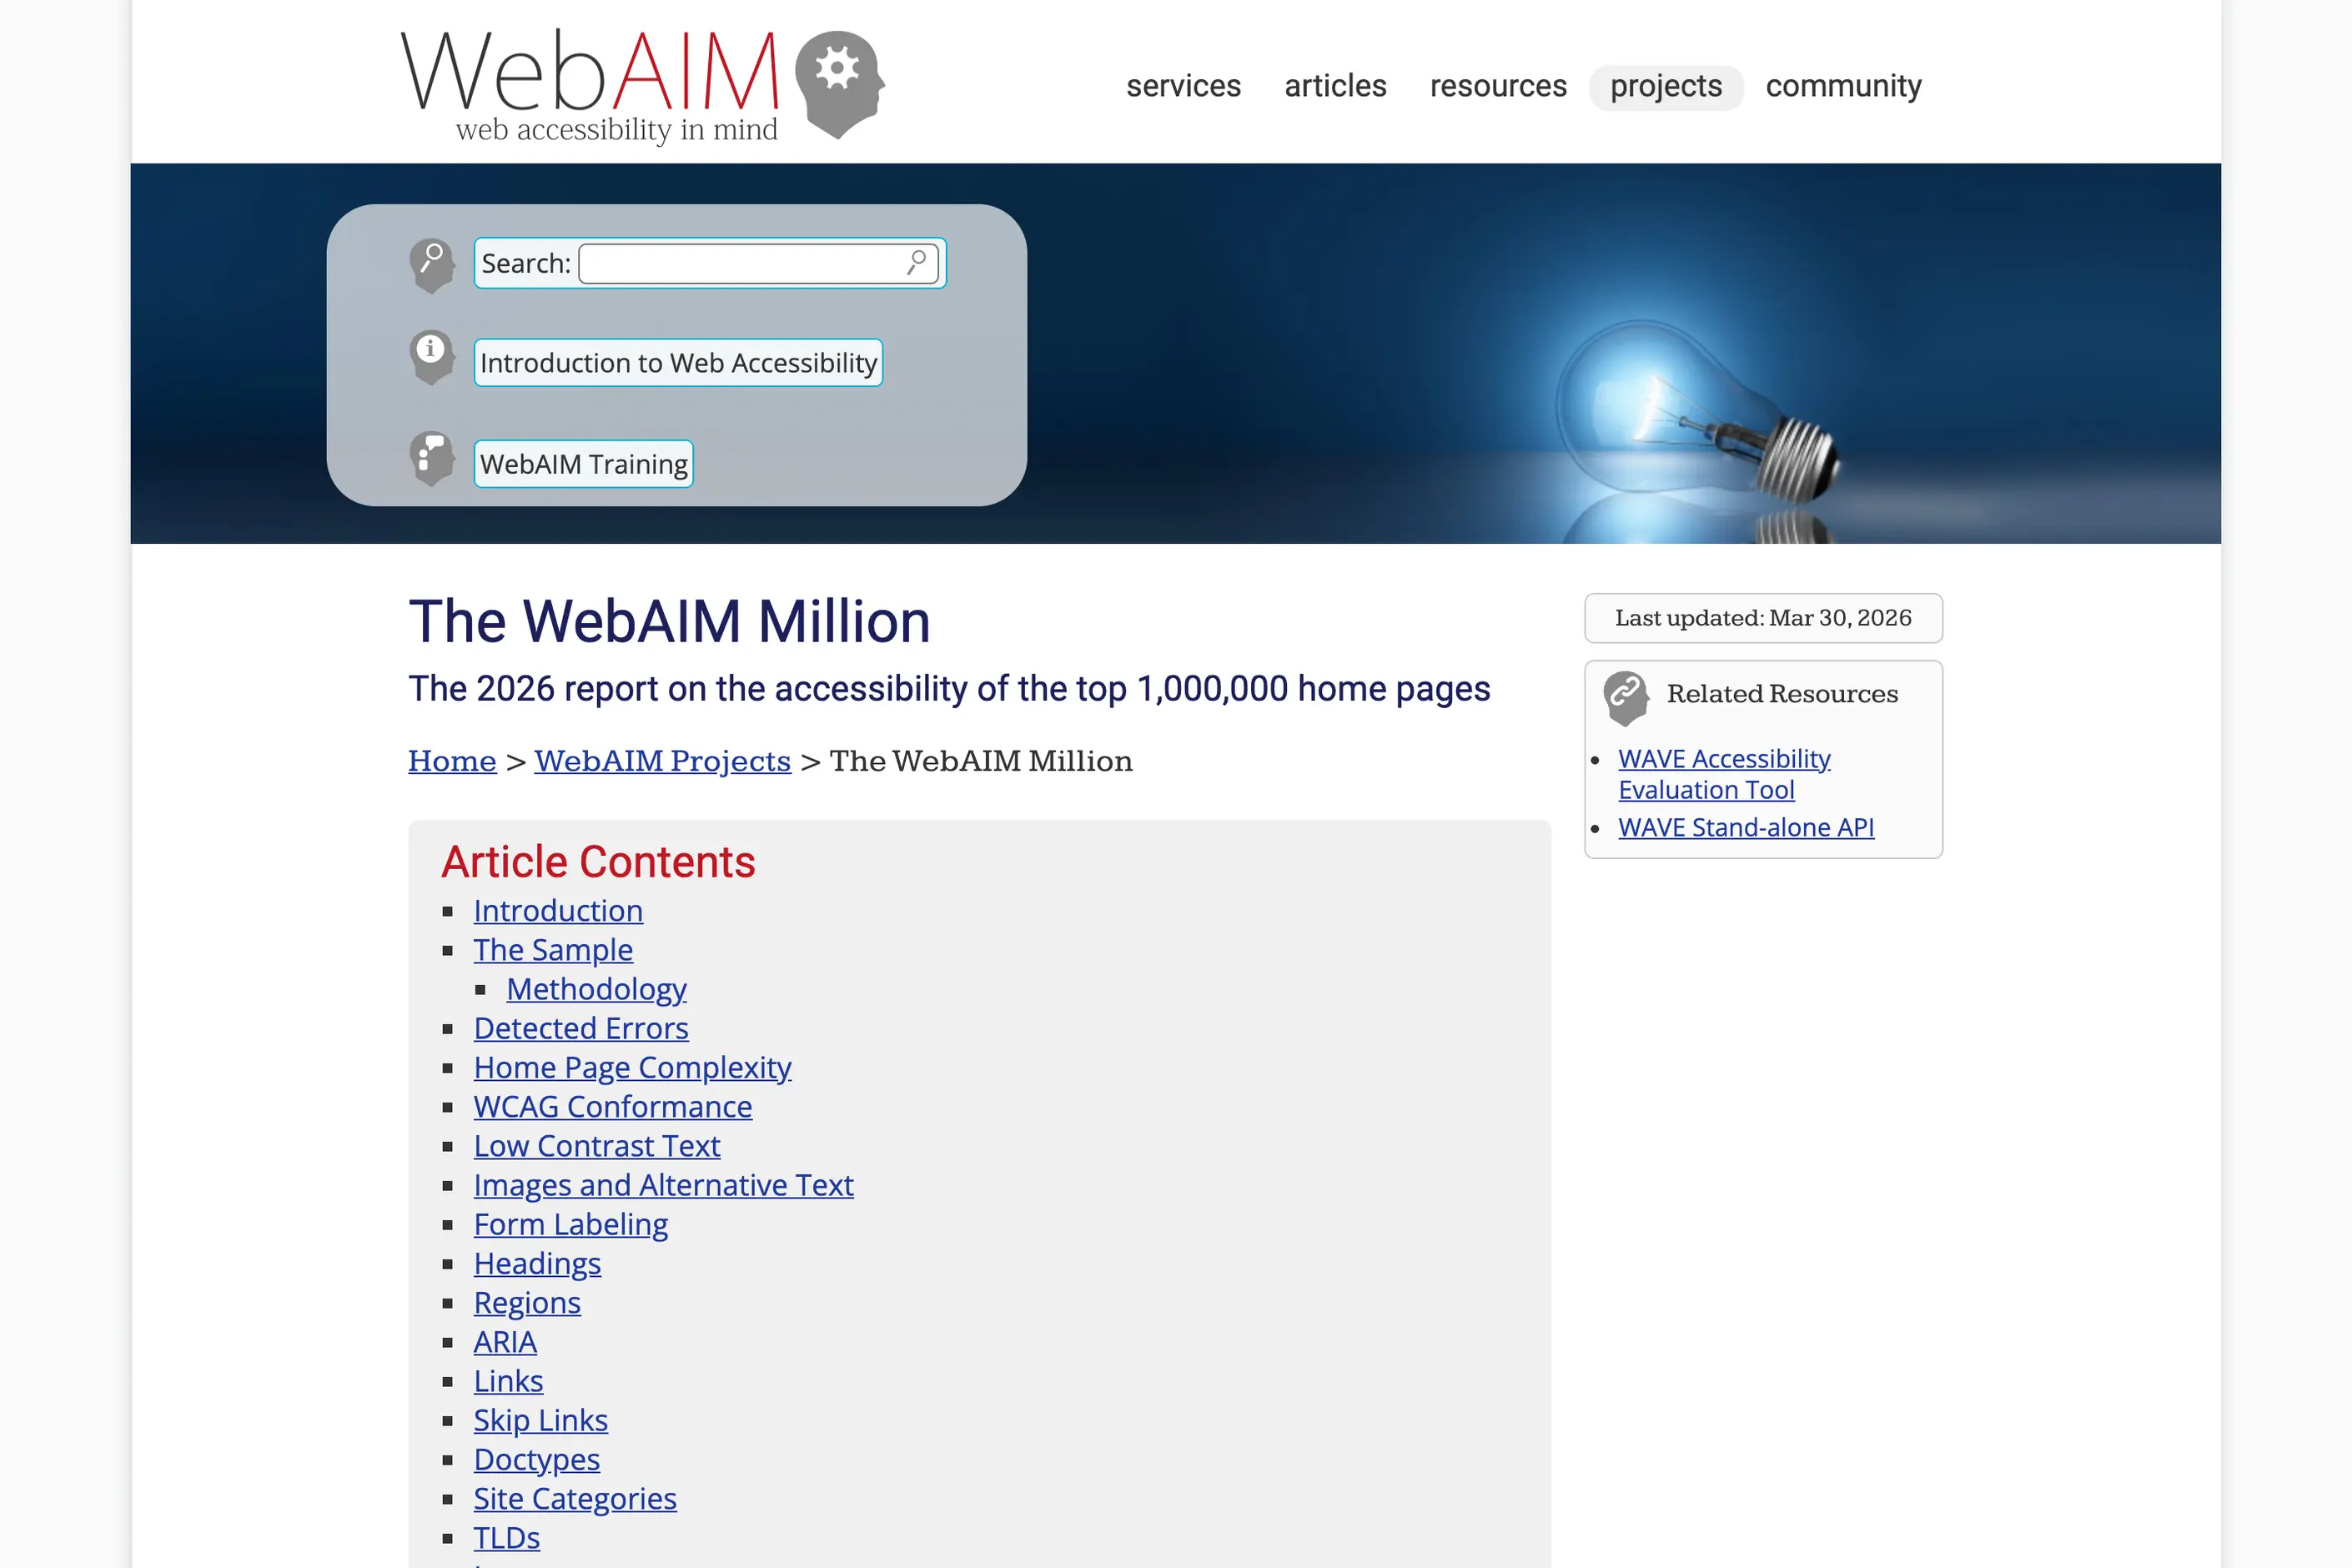
The compliance position is getting worse rather than better. WebAIM’s 2026 survey of the top million home pages detected WCAG failures on 95.9 per cent of them, up from 94.8 per cent, reversing six consecutive years of small improvements [5]. Enforcement is rising while conformance falls, which is the precise shape of an exposure that is about to become somebody’s incident.
One caution before you use that number. It measures automatically detectable failures on home pages, so it understates real-world conformance in both directions. It is evidence of a widening gap, not an audit of your product.
They hold up better than most design claims, because engineering has been measuring rework for two decades.
A word on the baseline everyone quotes. The 20 to 40 per cent rework range is routinely attributed to NIST’s 2002 planning report, and I could not find those figures in the report itself. What NIST did publish is that identifying and correcting defects accounted for roughly 80 per cent of development cost, and that inadequate testing infrastructure cost the US economy 59.5 billion dollars a year, of which about 22.2 billion was avoidable through earlier testing [1]. Treat the 20 to 40 per cent as industry convention rather than as a NIST finding.
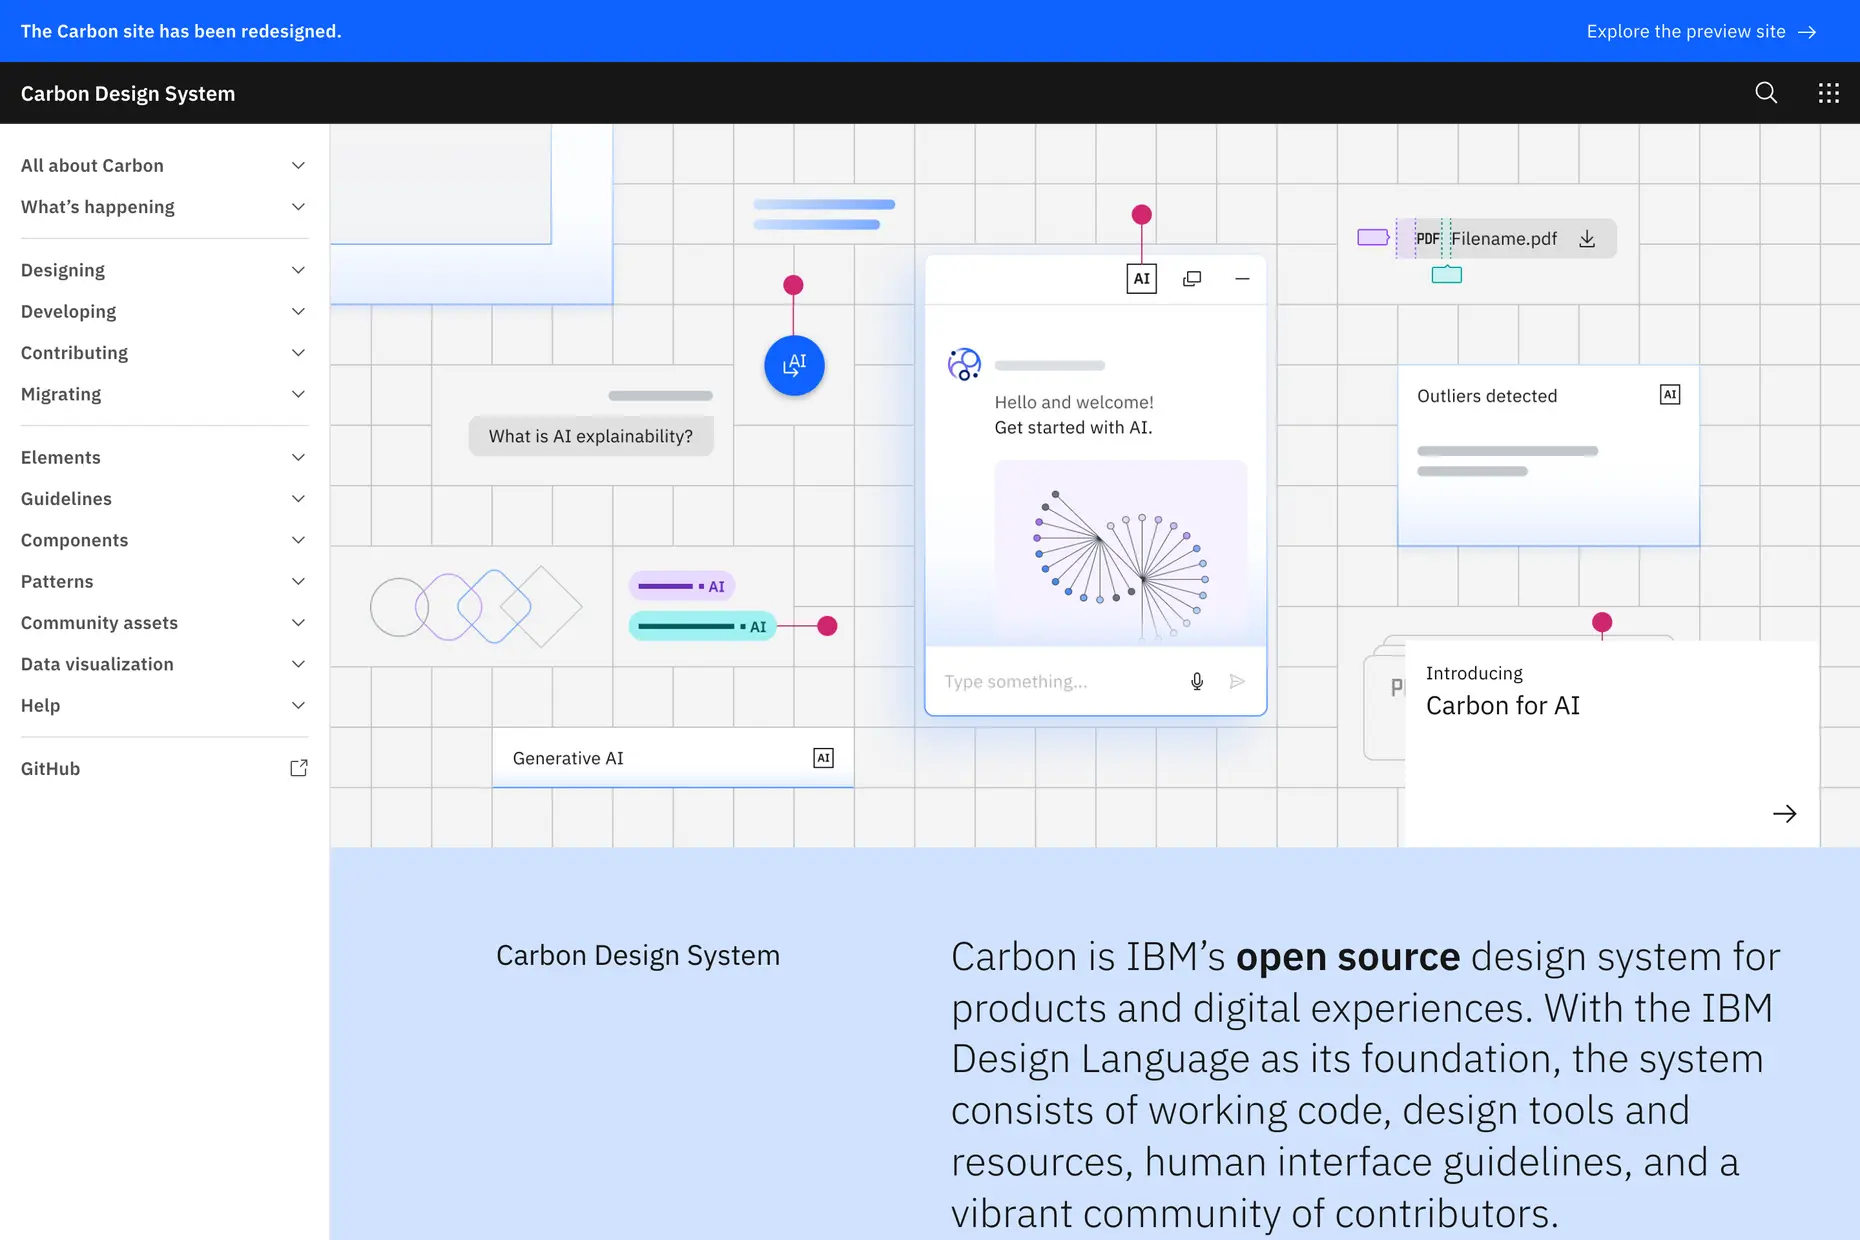
The cleanest controlled evidence for a design system is smaller and better run. Sparkbox timed eight developers building the same form from scratch and then with IBM’s Carbon design system: median 4.2 hours against 2 hours, a 47 per cent reduction, with familiarisation time included in the Carbon figure [2]. Eight developers is a small sample, and it is a real experiment rather than a vendor estimate.
Against that, the results I have measured sit inside the published range rather than above it. A design system with governed handoffs at a global specialty chemicals company cut rework by 25 per cent and deployment time by 40 per cent. At that same wealth platform, conformance went from 40 to 94 per cent WCAG AA once it was funded as regulatory exposure rather than as craft.
I am not claiming these are attributable to design alone. Each sat inside a wider programme, and no control group was run.
Rewrite each ask as an exposure with a control and a measure, then take it to the risk function before you take it to the budget holder.
Translate the ask. “We need a design system for consistency” becomes “we carry brand and execution exposure across fifteen product teams; a governed system is the control; component reuse and rework rate are the measures.”
Get it into the register. An exposure that lives only in your deck is a preference. One that lives in the operational risk register has a review date and an owner, and it gets revisited without you asking.
Report reductions rather than improvements. “Accessibility conformance moved from 40 to 94 per cent, closing a regulatory exposure” lands differently from “accessibility improved.”
There is an honest limit to this. Risk framing wins budget for the things that genuinely reduce exposure, and it is useless for the work whose value is that the product becomes better than it needed to be. That work still has to be argued for on its merits, and I have not found a way to smuggle it through a risk register.
So before your next funding conversation, one test. If your proposal were declined and the worst case arrived eighteen months later, could you point to where you recorded the exposure, and who signed the decision not to control it?
Grades: primary means the issuing body’s own publication; secondary means a third party reporting it; first-party means my own measurement.
First-party figures in this piece, measured on engagements I led and without a control group: 52 sub-teams and the seven-category reframe at a UK retail bank; 25 per cent rework reduction and 40 per cent faster deployment at a global specialty chemicals company; accessibility conformance from 40 to 94 per cent WCAG AA at a wealth platform.

Operational value creation is becoming the primary source of private equity returns. Product infrastructure is the lever most value-creation plans leave out, and the evidence for it.
Read it
Product infrastructure decides how fast a business can scale its output. Treat the design system, the component library and the governance around them as a cost centre, and growth stays capped. That cap holds whether anyone admits making the decision or not.
Read it
Digital accessibility is the practice of building products people can use, whatever their permanent, temporary, or situational disability, measured against a published standard rather than opinion.
Read it
AI generates components faster than review can catch them. Design governance, not tooling, is the control that stops generated work fragmenting your system.
Read it