

2026-09-15
Nural Choudhury
Mind mapping is a technique for organising ideas around a central topic using branching, radial diagrams instead of linear lists.
A problem too tangled to write down in order, where forcing it into an outline demands a structure you don’t have yet. Mapping lets you follow associations first and find the structure afterwards.
Take the branches and cross-links you found and turn them into a structured document. Where you need process or dependency rather than association, feed the same problem into a task analysis instead.
A radial map, central topic, first-level branches, sub-branch keywords, and any cross-links between them, plus the legend or outline you convert it into before showing it to anyone else. The map itself is not a shareable deliverable.
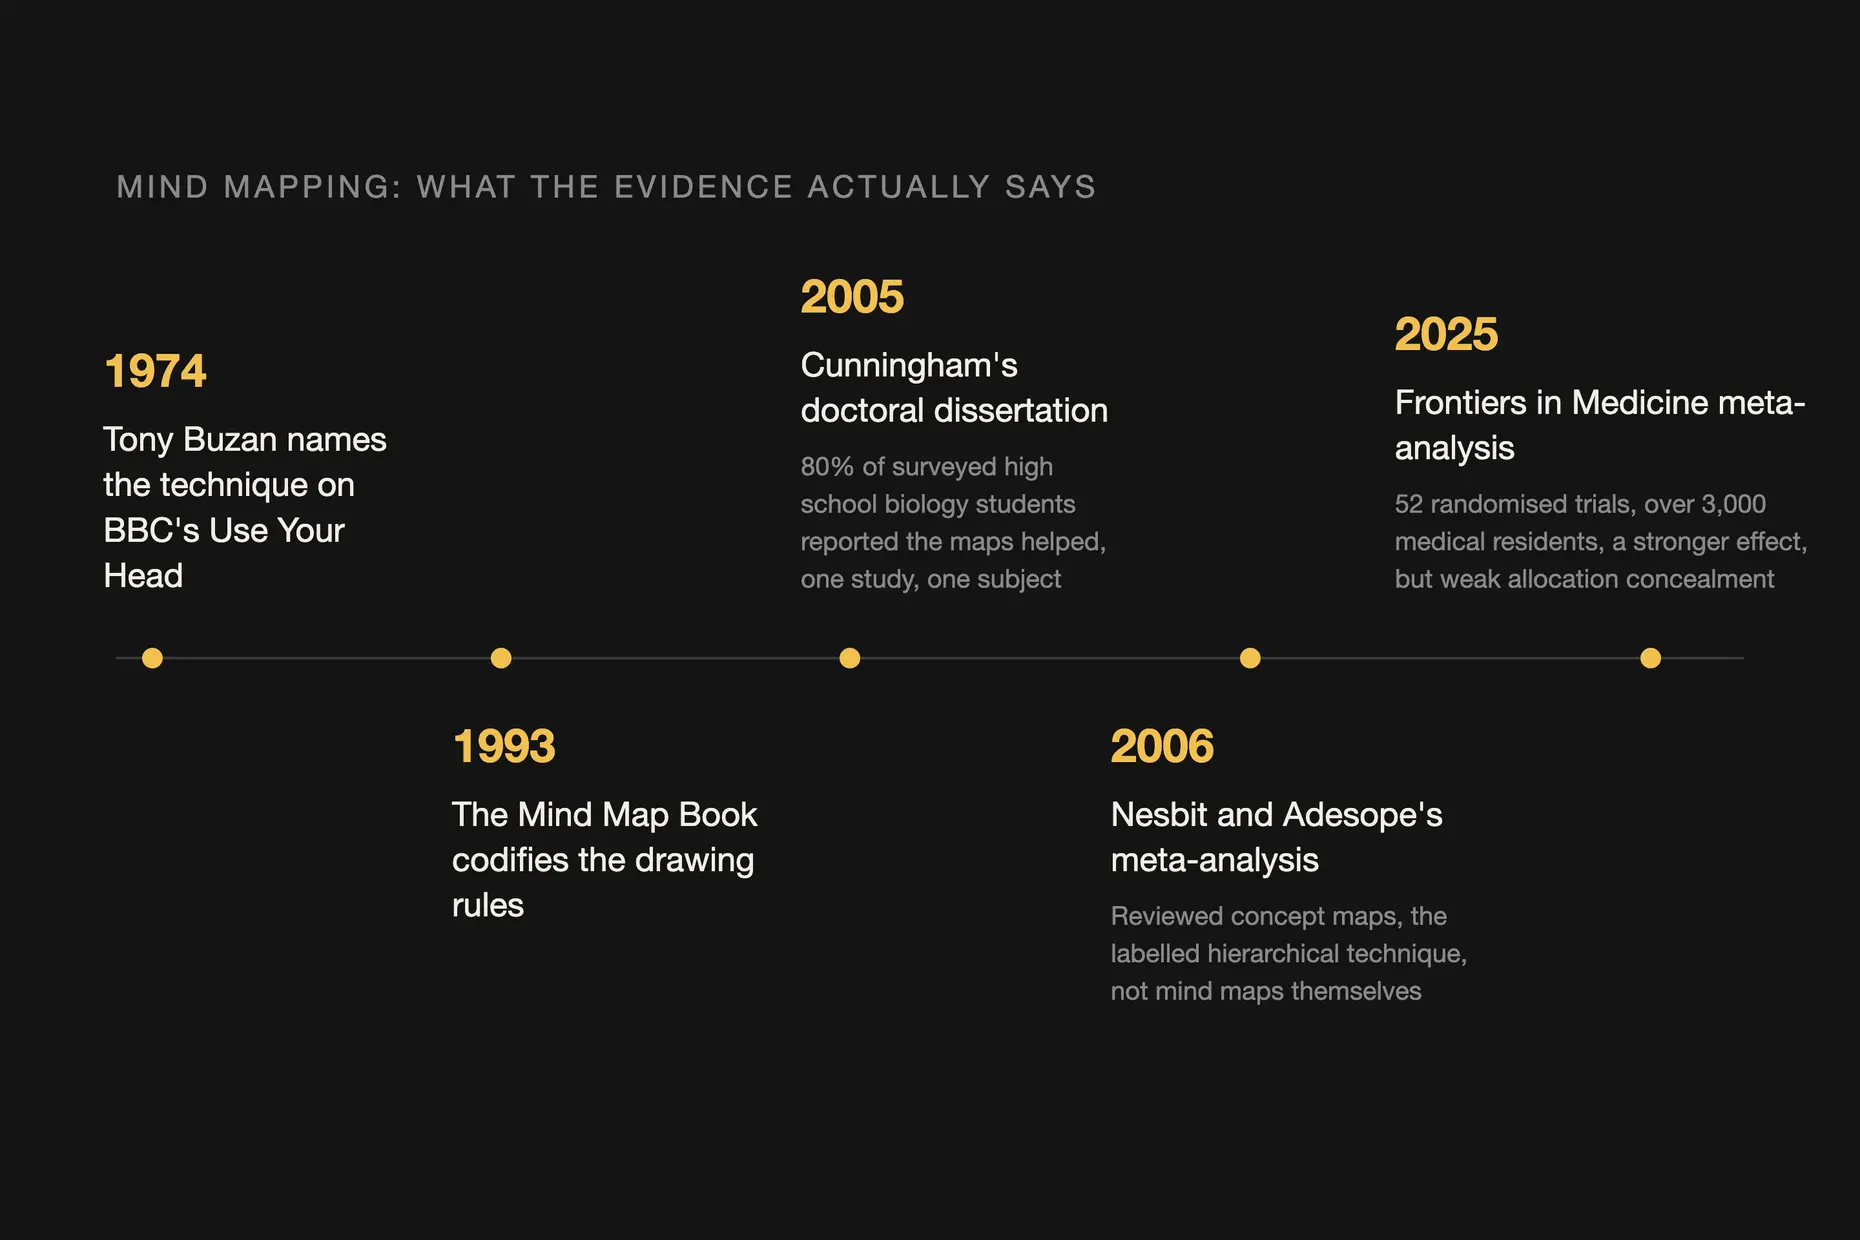
Buzan didn’t invent radial, associative diagrams: people have drawn branching notes and family trees for centuries. In 1974, on his BBC series “Use Your Head”, he named the technique, codified a specific set of drawing rules, and later expanded them in “The Mind Map Book” (1993). The Buzan Organisation still holds the trademark on “Mind Maps” in the UK, the US and Germany, for self-improvement courses.
Buzan also marketed the technique as “whole-brain thinking”, built on the popular idea that logical work happens in a separate “left brain” and creative work in a separate “right brain”. Neuroscientists widely regard that strict split as an oversimplification; treat the whole-brain framing as Buzan’s own marketing, not as an established finding.
The cognitive concepts mind mapping genuinely draws on- dual coding, chunking, and spatial memory- are established psychology, though they don’t by themselves prove mind maps beat other note-taking formats. The figure most often quoted for the technique itself comes from Glennis Edge Cunningham’s 2005 doctoral dissertation at the University of Texas at Austin, where 80 per cent of the high-school biology students surveyed said mind maps helped them understand the material, a self-reported result from one study of one subject and age group. The meta-analysis most often cited alongside that figure, Nesbit and Adesope’s 2006 review in Review of Educational Research, measured concept maps, the labelled, hierarchical technique, not mind maps themselves, so treat its effect size as adjacent evidence rather than proof for this method.
Direct evidence for mind mapping has grown since: a 2025 meta-analysis in Frontiers in Medicine, pooling 52 randomised trials and over 3,000 medical-residency participants, found a stronger effect than the older literature implied. Almost all of those trials lacked allocation concealment, and results varied widely between studies, so treat the number as suggestive rather than settled.
I reach for mind mapping when I’m exploring an unstructured problem, scoping a project before committing to a plan, or synthesising notes from a meeting or reading. It’s the wrong tool once you already know the answer and need to write it down.
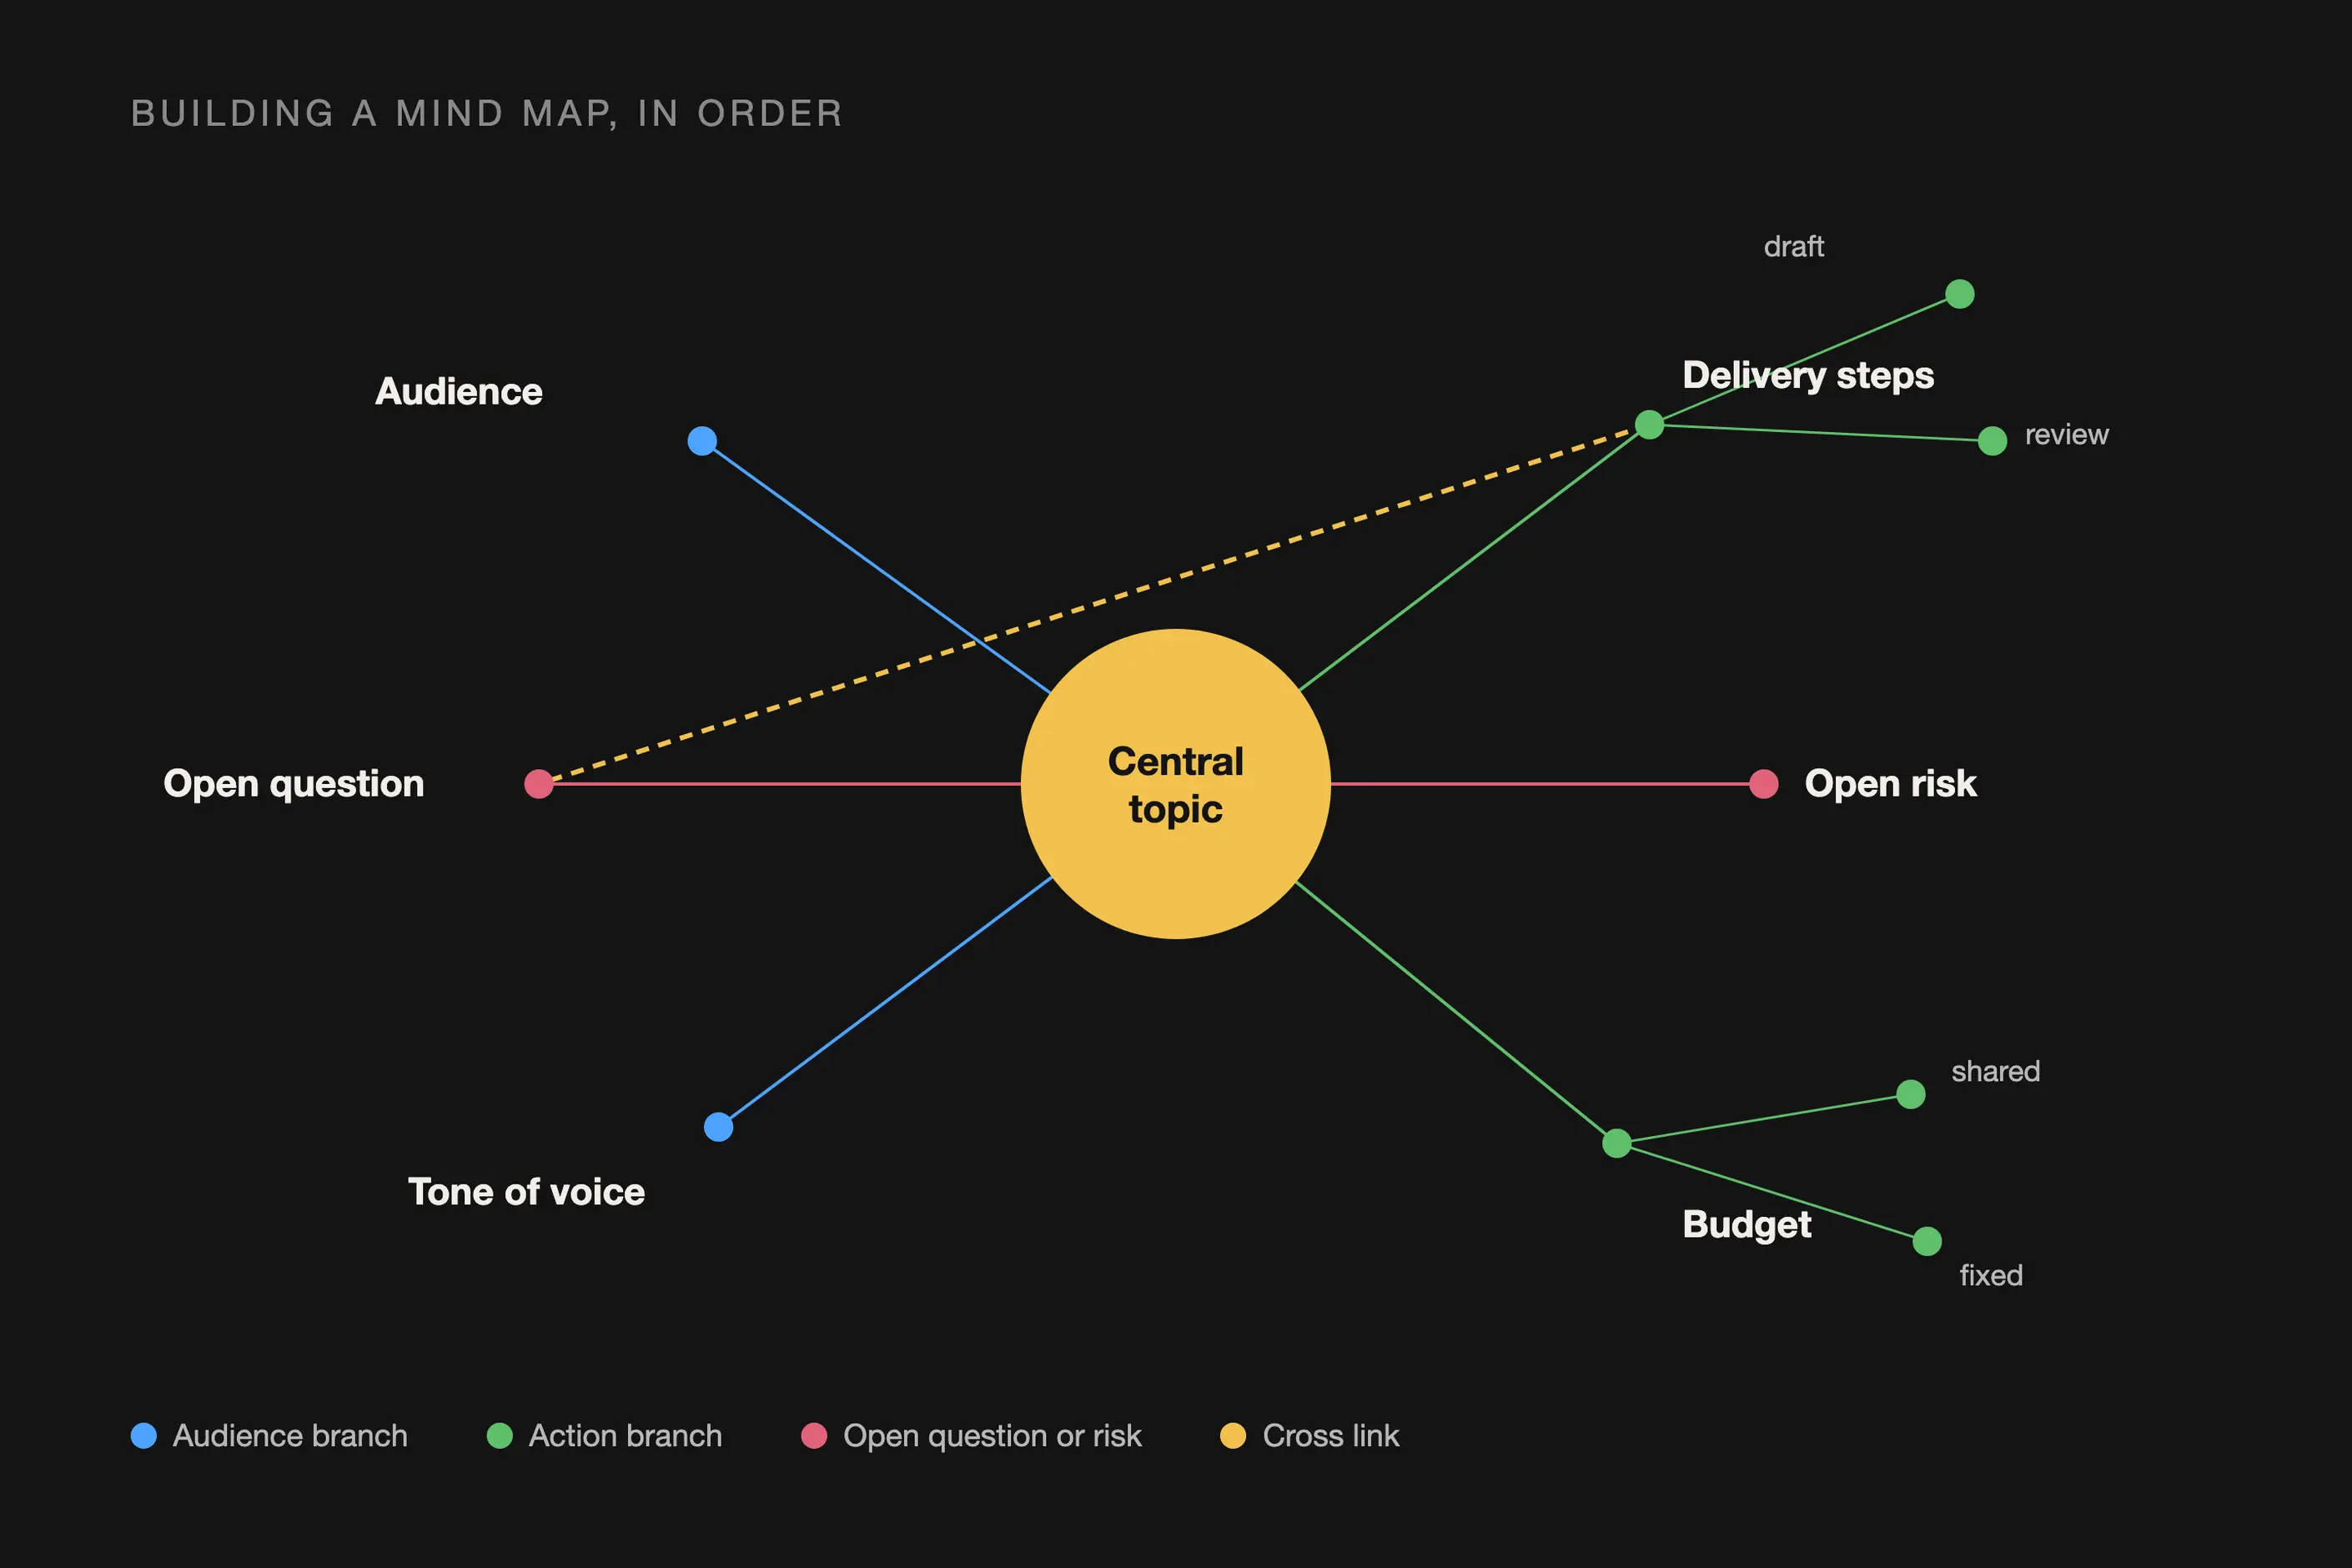
Build a map in this order. Don’t skip the review step: skipping it is the single most common way I’ve seen a map end up as clutter instead of clarity.
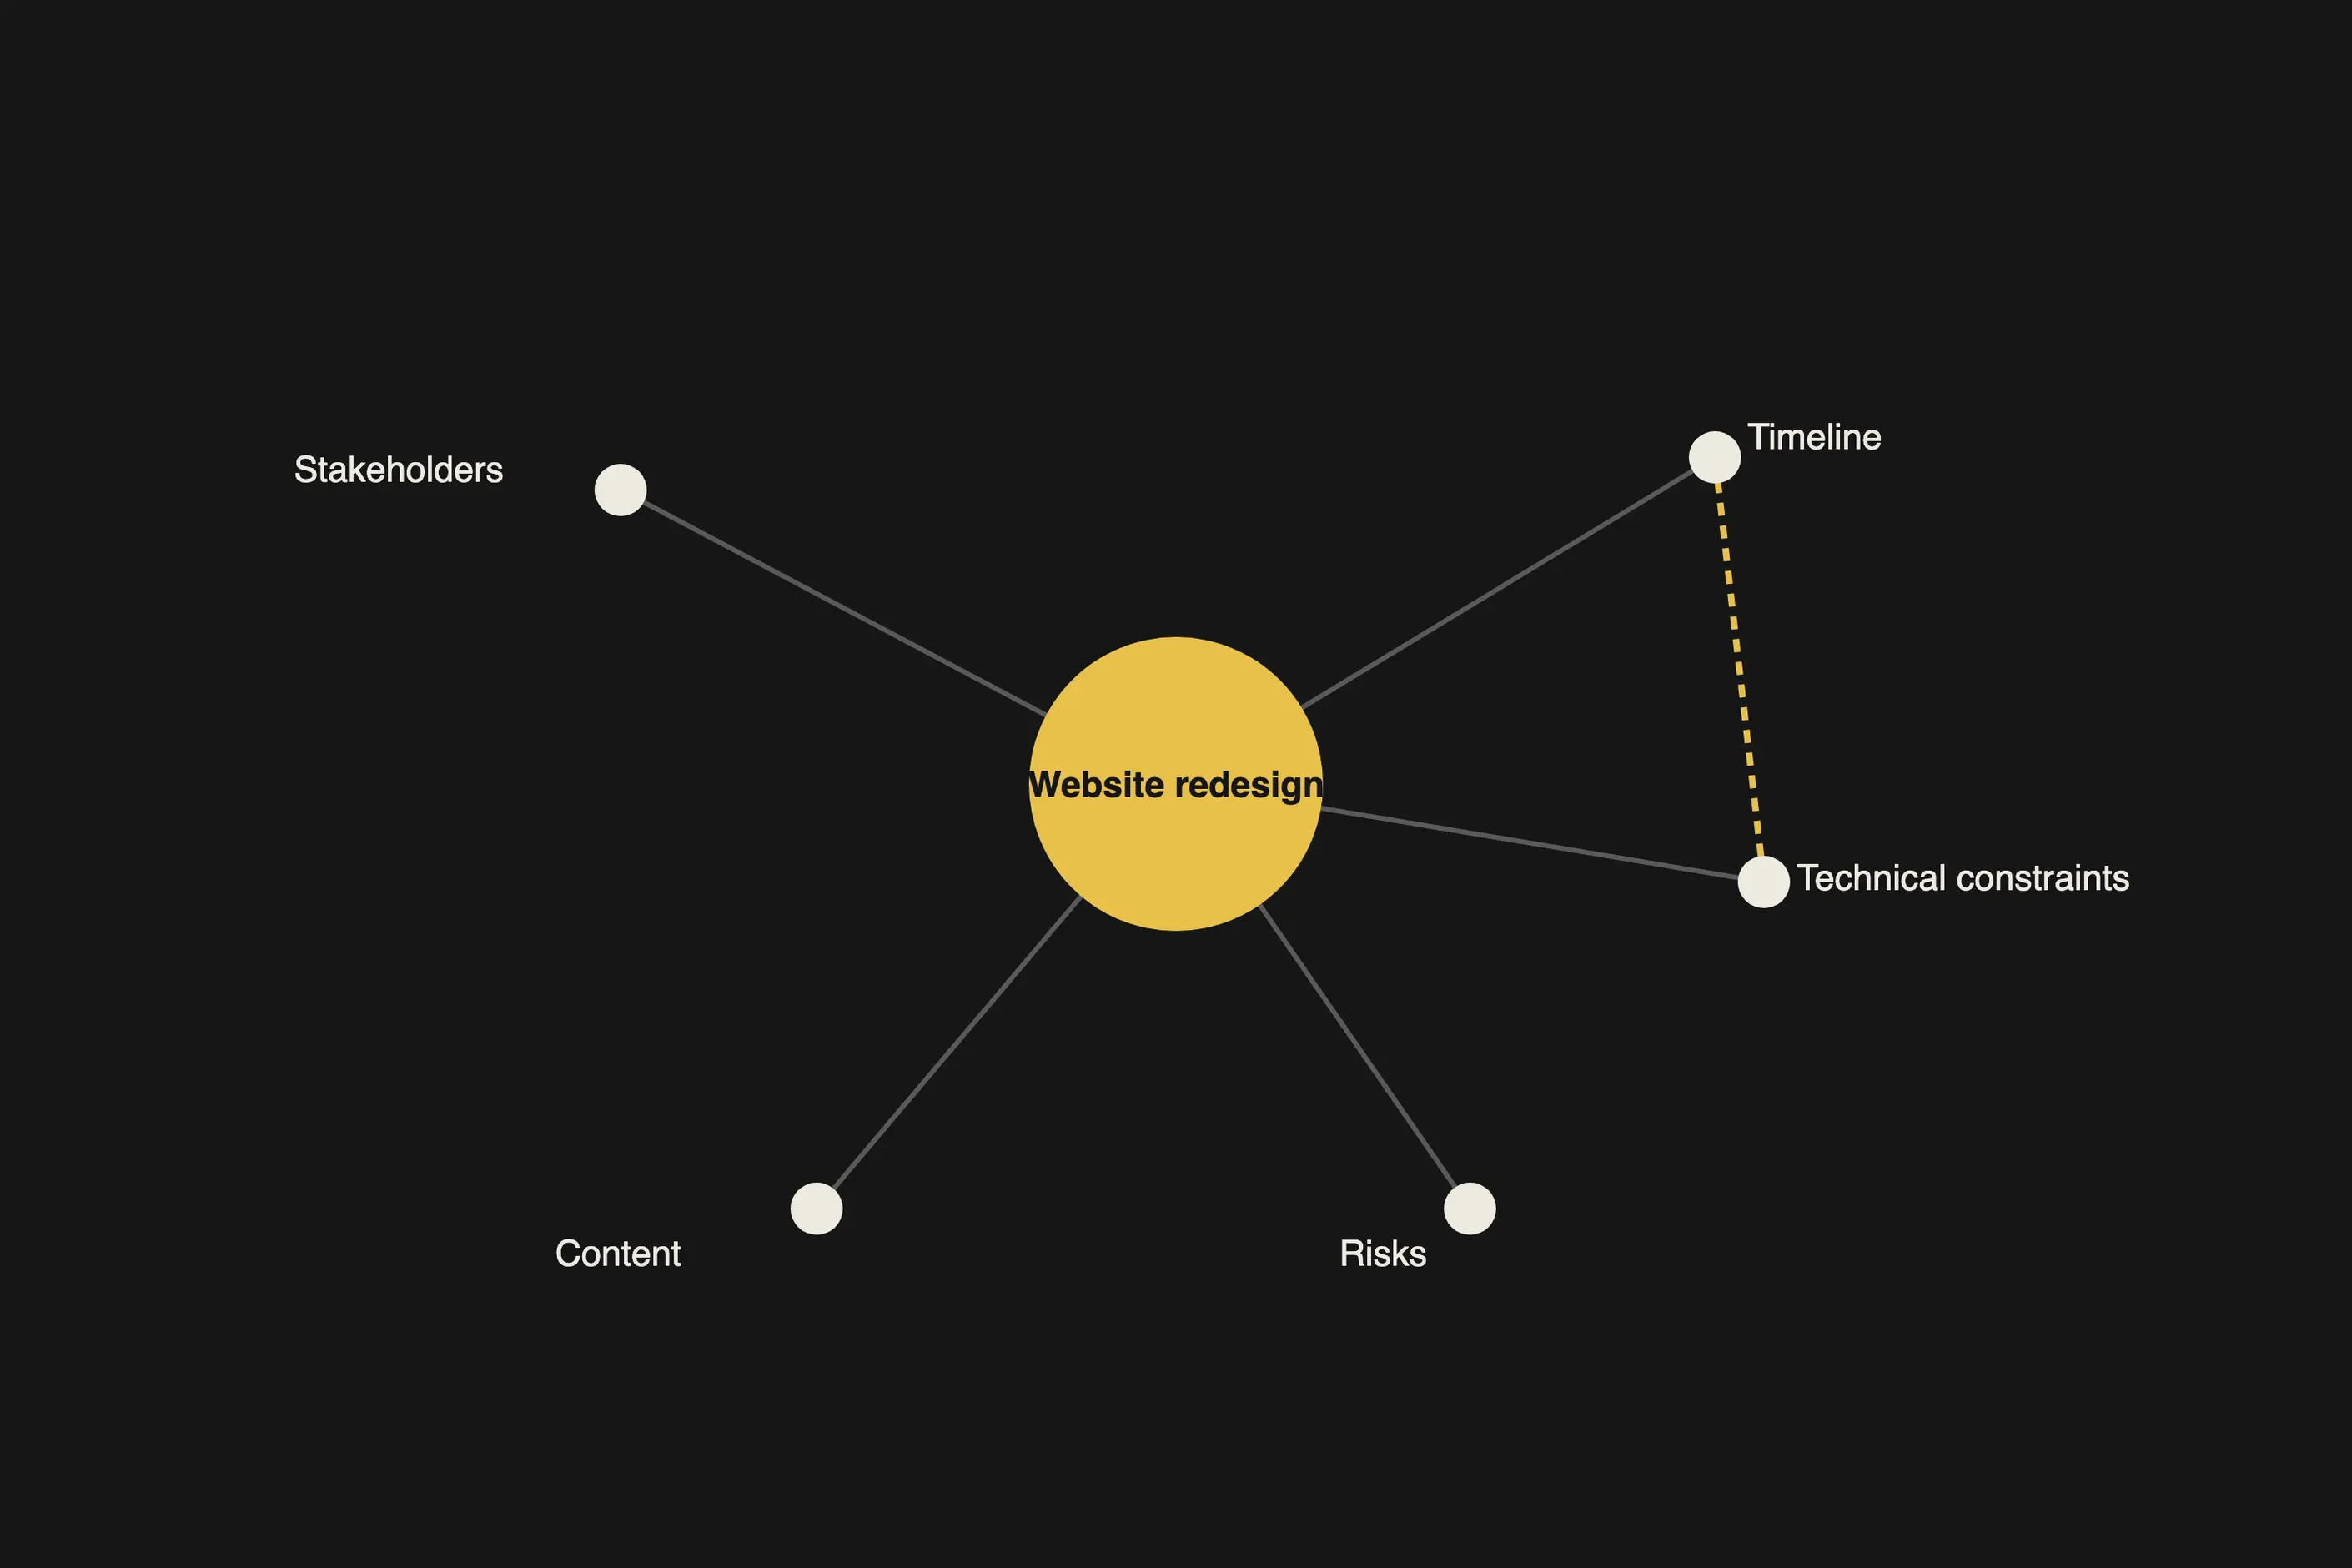
Say you’re scoping a website redesign with six weeks until launch. Write “Website redesign” in the centre and draw five first-level branches: stakeholders, content, technical constraints, timeline, and risks.
Under stakeholders, add three sub-branches: marketing, who wants a new hero section; sales, who wants clearer pricing; IT, who owns the CMS migration. Under timeline, add four sub-branches, one per two-week sprint. Within about twenty minutes you have five branches and roughly twenty sub-branches, and a cross-link becomes obvious between timeline and technical constraints: the CMS migration needs a full sprint on its own, which the current six-week plan doesn’t allow for.
That cross-link, not the branch count, is the reason to run the exercise. A linear meeting agenda would likely have surfaced the same conflict in week four, once it was expensive to fix; the map surfaces it in the first twenty minutes, while replanning is still cheap.
It doesn’t scale. I’ve watched a map stop helping past a few dozen nodes and turn into visual noise. Once a branch grows past what fits on one screen without scrolling, I split it into linked sub-maps or move it into a structured document.
Radial layouts don’t share or version well. A map doesn’t diff the way a document does, and the colour, position, and shorthand choices that made sense to me while drawing it rarely survive when I hand it to someone who wasn’t in the room. I export dated screenshots when I need a history; I don’t rely on the file itself.
It captures association, not sequence or dependency. A map shows me that two things are related, not which comes first or which blocks which. When I need process or dependency, I reach for a task analysis instead of forcing a map to do a job it isn’t built for.
One person’s map is often unreadable to anyone else. The associations that were obvious to me while drawing rarely survive being handed over cold. I add a short legend, or convert the map into an outline, before circulating it beyond myself.

There’s no fixed duration; it scales with the map’s purpose. A quick personal map for exploring one topic takes minutes. A facilitated group session scoping a whole project takes much longer, and I always give it an explicit time-box; time-boxes otherwise expand indefinitely.
Do I need special software? No. I use paper and a pen for solo work; it’s often faster because there’s no login or interface to learn. Digital tools such as Miro, MindMeister, or XMind earn their place once a map needs to be shared, searched, or revised by more than one person.
Can mind mapping work for a whole team? Yes, with one person holding the pen. A facilitator captures contributions on a shared surface while the group calls them out, or each person maps individually first, and the group combines the results afterwards. Either way, I make sure someone owns the drawing, because otherwise the session stalls.
Does neuroscience back mind mapping? Some of it. Dual coding, chunking, and spatial memory are established psychology, but the “whole-brain thinking” and left-brain, right-brain framing that surrounds mind mapping is marketing, not evidence, and trials of the technique itself now show stronger effects than older reviews suggested, though most remain poorly controlled. Treat the neuroscience claims with the same scepticism you’d apply to any other unreferenced statistic.
A mind map radiates from one central topic and favours speed and free association over precision. A concept map allows multiple starting points and labels the relationship between each pair of ideas, trading some of that speed for a structure that’s easier for someone else to read cold.
| Fact | Detail |
|---|---|
| Popularised by | Tony Buzan |
| Introduced | 1974, on Buzan’s BBC television series “Use Your Head” |
| Properly called | Mind map. The Buzan Organisation holds the trademark on “Mind Maps” in the UK, the US and Germany, for self-improvement courses |
| Group size | No fixed minimum or maximum. Works for one person alone, up to a full team with one person holding the pen |

Crazy Eights is a timed sketching exercise: each person draws eight distinct ideas in eight minutes, one per folded panel, to force past the first, safest idea.
Read it
SCAMPER is a seven-lens checklist: substitute, combine, adapt, modify, put to another use, eliminate, rearrange, for generating ideas about something that already exists.
Read it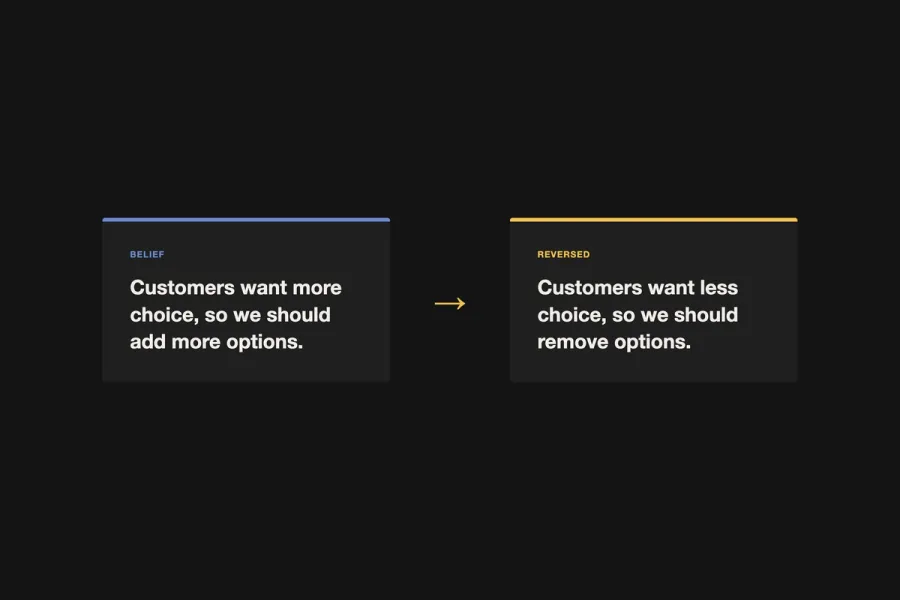
Opposite thinking, also called assumption reversal, surfaces the hidden assumptions in a problem statement, inverts them, and uses the inversions as prompts for new solutions.
Read it
A design sprint is a five-day process that takes a team from a business problem to a tested prototype, revealing whether an idea works before it is built.
Read it
A service blueprint is a diagram that maps what a customer experiences against the staff actions and systems that produce it, on one shared timeline.
Read it
Task analysis is the systematic study of how people currently perform a task, breaking it down into the steps, decisions and knowledge each one requires.
Read it
An idea evaluation matrix is a structured scoring tool that ranks competing ideas against a shared set of weighted criteria, typically value, effort, and risk, so a team can compare options that all look plausible consistently rather than by whoever argues loudest.
Read it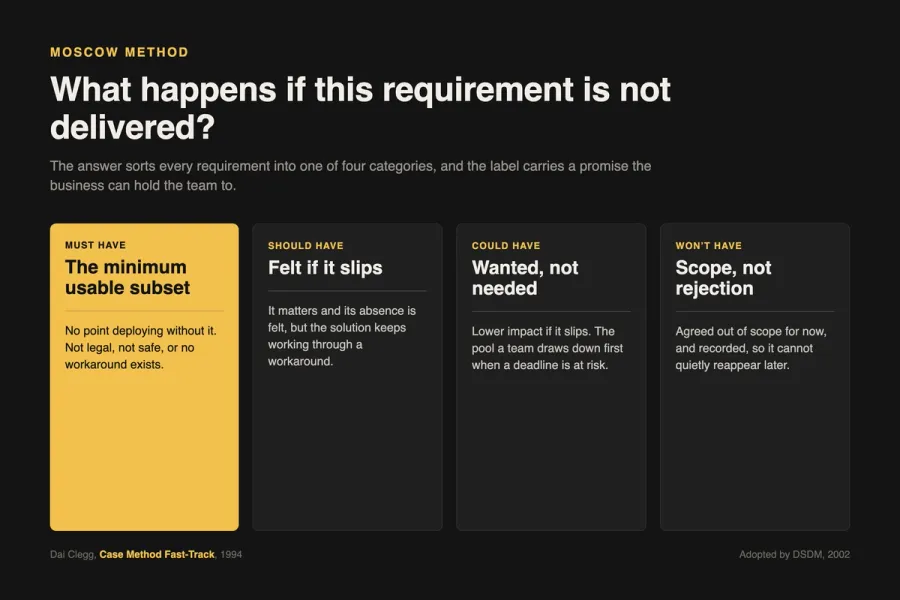
The MoSCoW method is a requirements-prioritisation technique that sorts features into Must Have, Should Have, Could Have, and Won’t Have, protecting a fixed delivery date without cutting corners nobody chose to cut.
Read it
The Eisenhower Matrix is a prioritisation tool that sorts work into four quadrants by urgency and importance, so a leader spends deliberate time on what matters instead of only reacting to what shouts loudest.
Read it